
Get your Apple Watch data using CWCloud FaaS engine

· 6 min read
Idriss Neumann
founder cwcloud.tech

This blog post will help us illustrate a concrete use case for using CWCloud's FaaS1 engine — both to expose serverless functions as public webhooks, and to show how to interact with LLMs2.

Besides IT, I enjoy doing sports regularly, especially running and powerlifting. For some time now, I’ve been using an Apple Watch SE to collect metrics and track my progress, especially in terms of endurance and cardio.

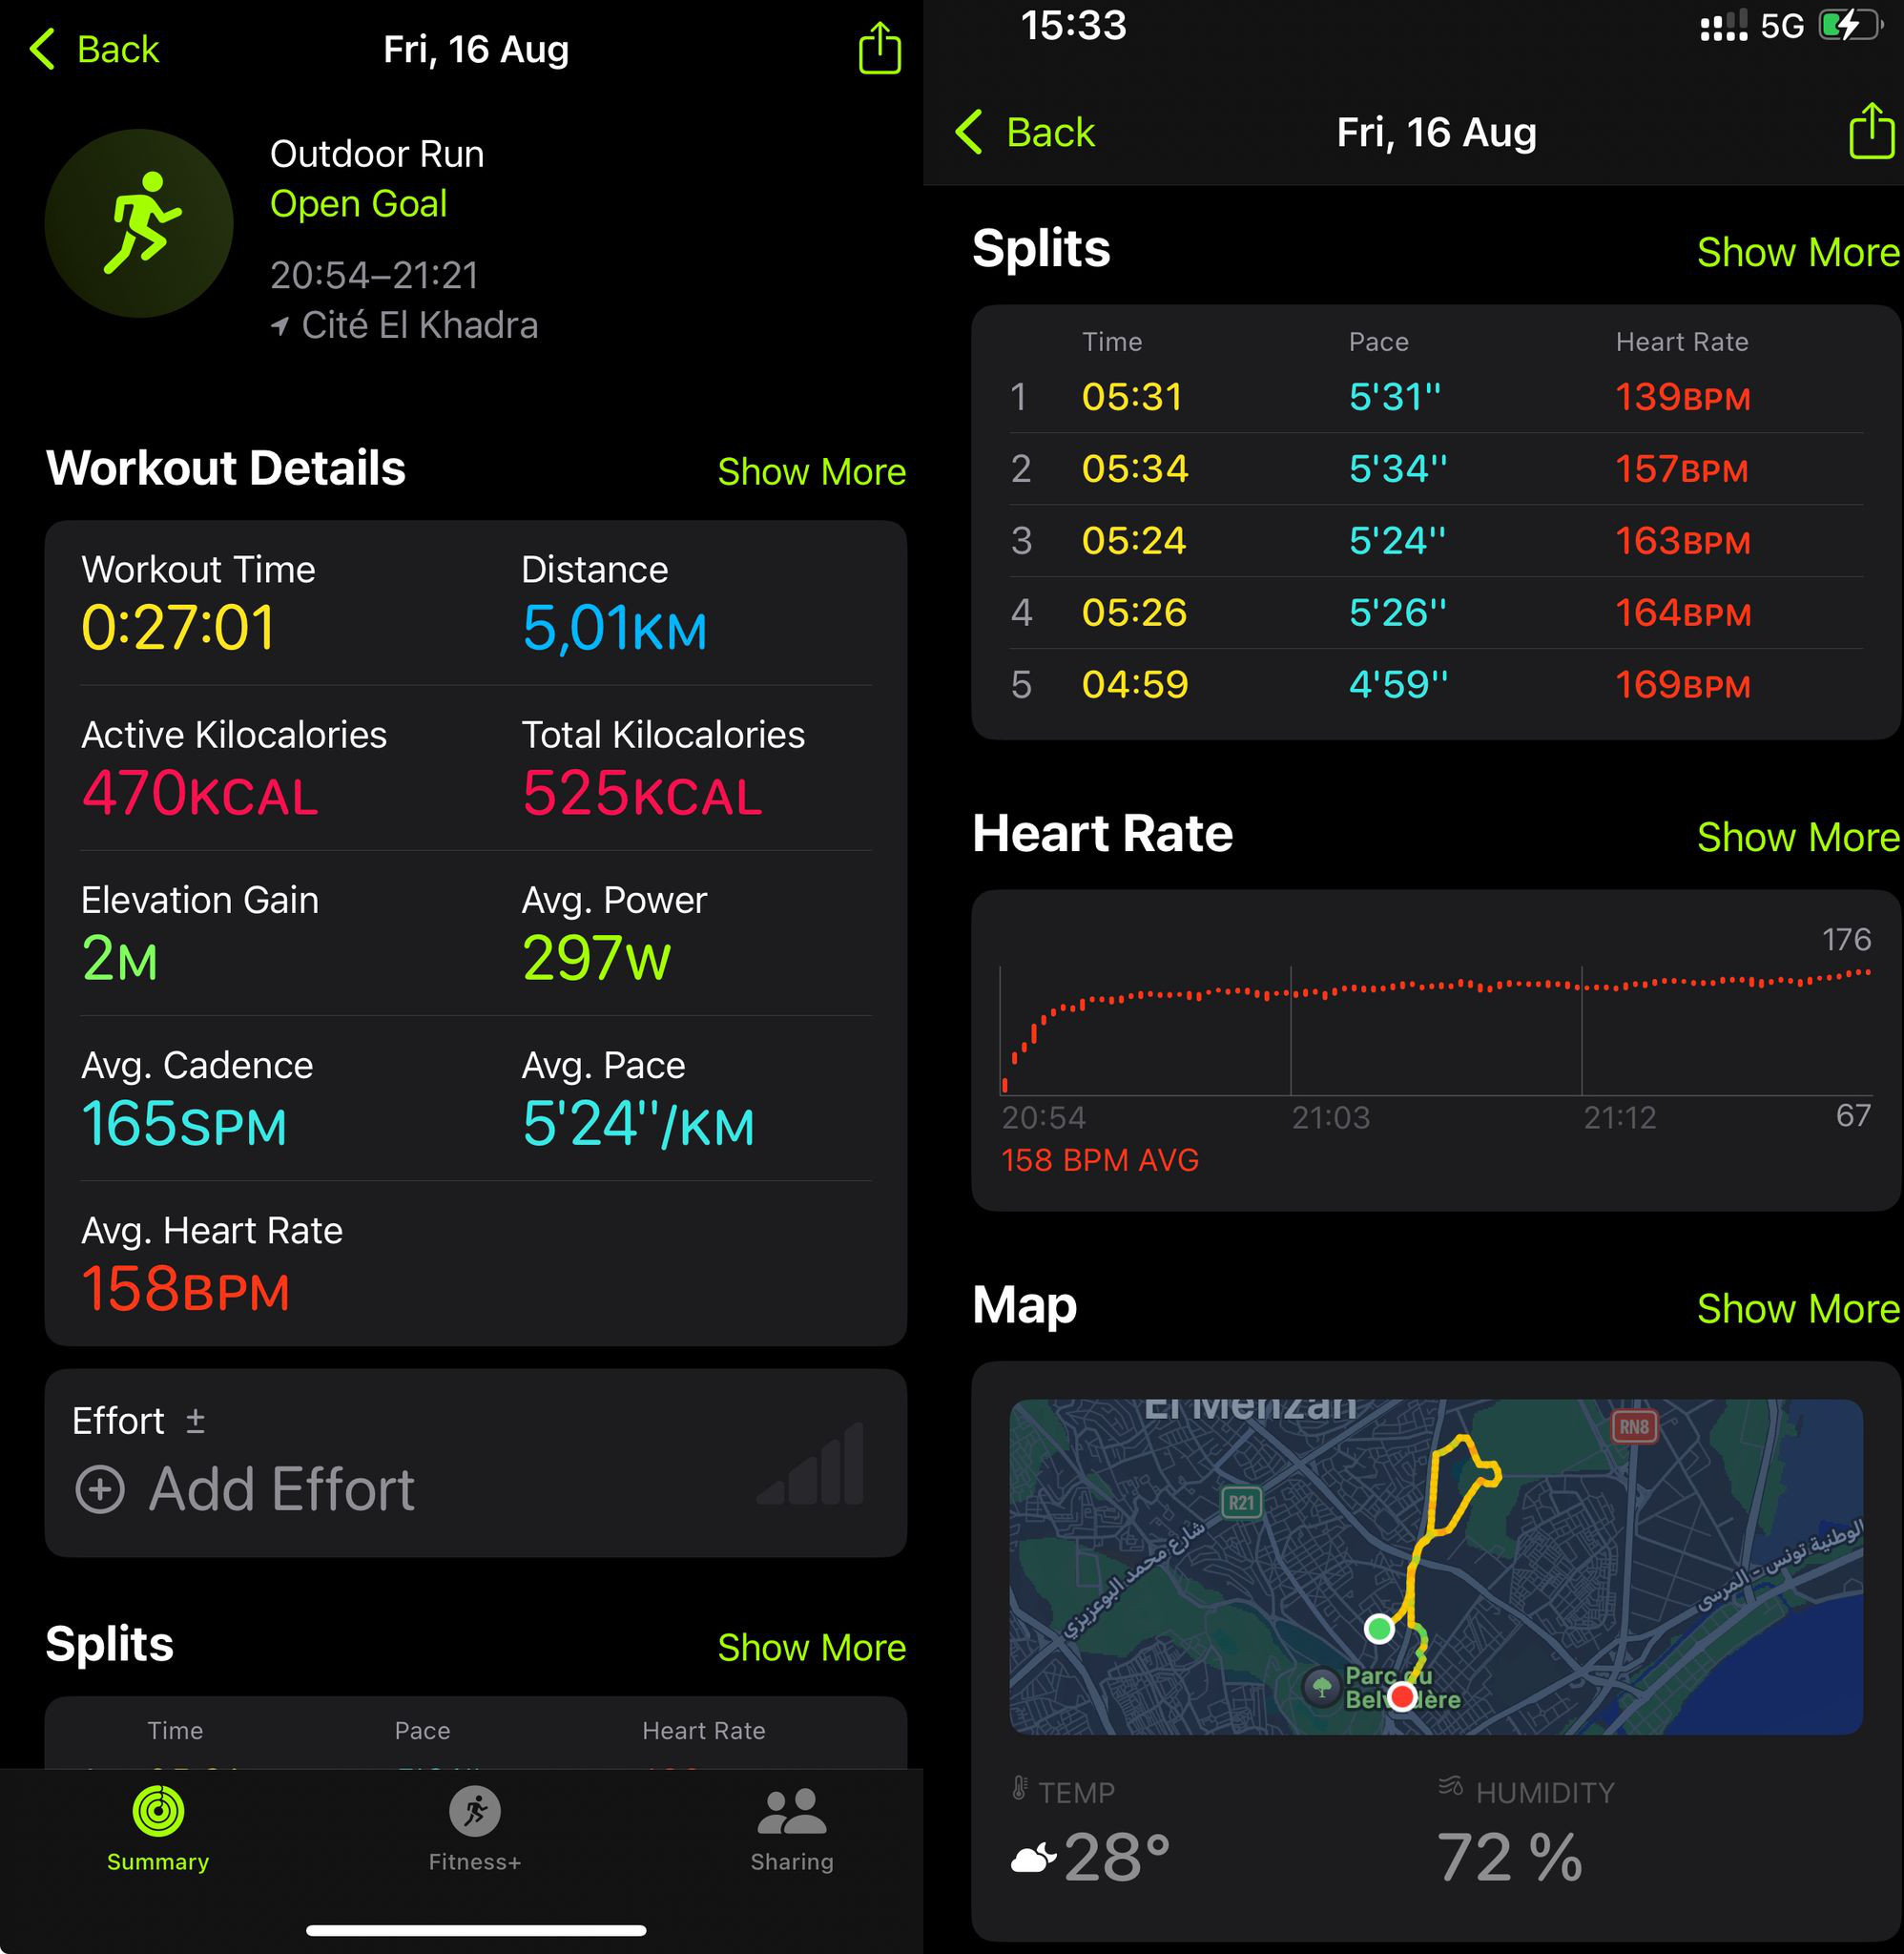
For a "non-tech" user, the level of detail and data presentation during an exercise is very satisfying. Here's, for example, a breakdown of what happens during a run: GPS positions, heart rate, and zones throughout the workout...

apple-activity-dashboard

The watch also provides tons of other data on sleep quality, resting heart rate, calories burned... but there’s always been one thing that frustrates me compared to other models I’ve used in the past, like Fitbit watches: no webservice nor API for developers. And yet, I’d really like to fetch those data in order to process it with LLMs using the CWCloud low-code FaaS engine.

However, no online API doesn’t necessarily mean it’s impossible to retrieve the data: we can see that many apps on the iPhone still manage to access the watch’s data, like Strava, MyFitnessPal...

Most of the time, these apps access data directly from the iPhone using Apple’s HealthKit framework and by requesting the proper permissions in Apple’s security settings.

Still, it requires quite a bit of effort for someone who’s not an iOS mobile developer to build and validate a Swift app just to send data to a webhook. So I looked to see if someone had already done that job — and someone had, with the Health Auto Export app.

The app has pretty bad reviews, but once you read the comments, it’s clear why: people didn’t understand what it’s for. It’s not about creating pretty statistical dashboards, but about exporting Apple health data in developer-friendly formats (CSV or JSON), and scheduling those exports to external connectors (REST/HTTP webhooks, MQTT files, Dropbox...).

In our case, that’s exactly what we needed. Here’s how to configure an HTTP webhook, for instance, to send the data to CWCloud in an automation that runs every minute:

health-auto-export

Every minute, the CWCloud serverless function receives a JSON payload in the following format:

{
"data" : {
"metrics" : [
{
"units" : "count\/min",
"data" : [
{
"Min" : 79,
"date" : "2025-06-30 23:17:40 +0200",
"Avg" : 79,
"Max" : 79,
"source" : "Idriss’s Apple Watch"
},
{
"Min" : 66,
"Max" : 66,
"Avg" : 66,
"source" : "Idriss’s Apple Watch",
"date" : "2025-06-30 23:23:45 +0200"
},
{
"Max" : 66,
"date" : "2025-06-30 23:26:52 +0200",
"source" : "Idriss’s Apple Watch",
"Min" : 66,
"Avg" : 66
}
],
"name" : "heart_rate"
}
]
}
}

In the automation, you'll notice I filtered only the heart_rate metric, because otherwise it would send many others — not just from the Apple Watch, but also from apps like MyFitnessPal, which tracks your macros (kcal, proteins, fats, carbs, calcium, etc.) from your diet. So there’s a lot of room for very interesting usecases here 😁.

That been said, this payload isn’t compatible with the interface contract of our serverless engine with the standard endpoints we’ve documented in several demos, where we expect function parameters in advance.

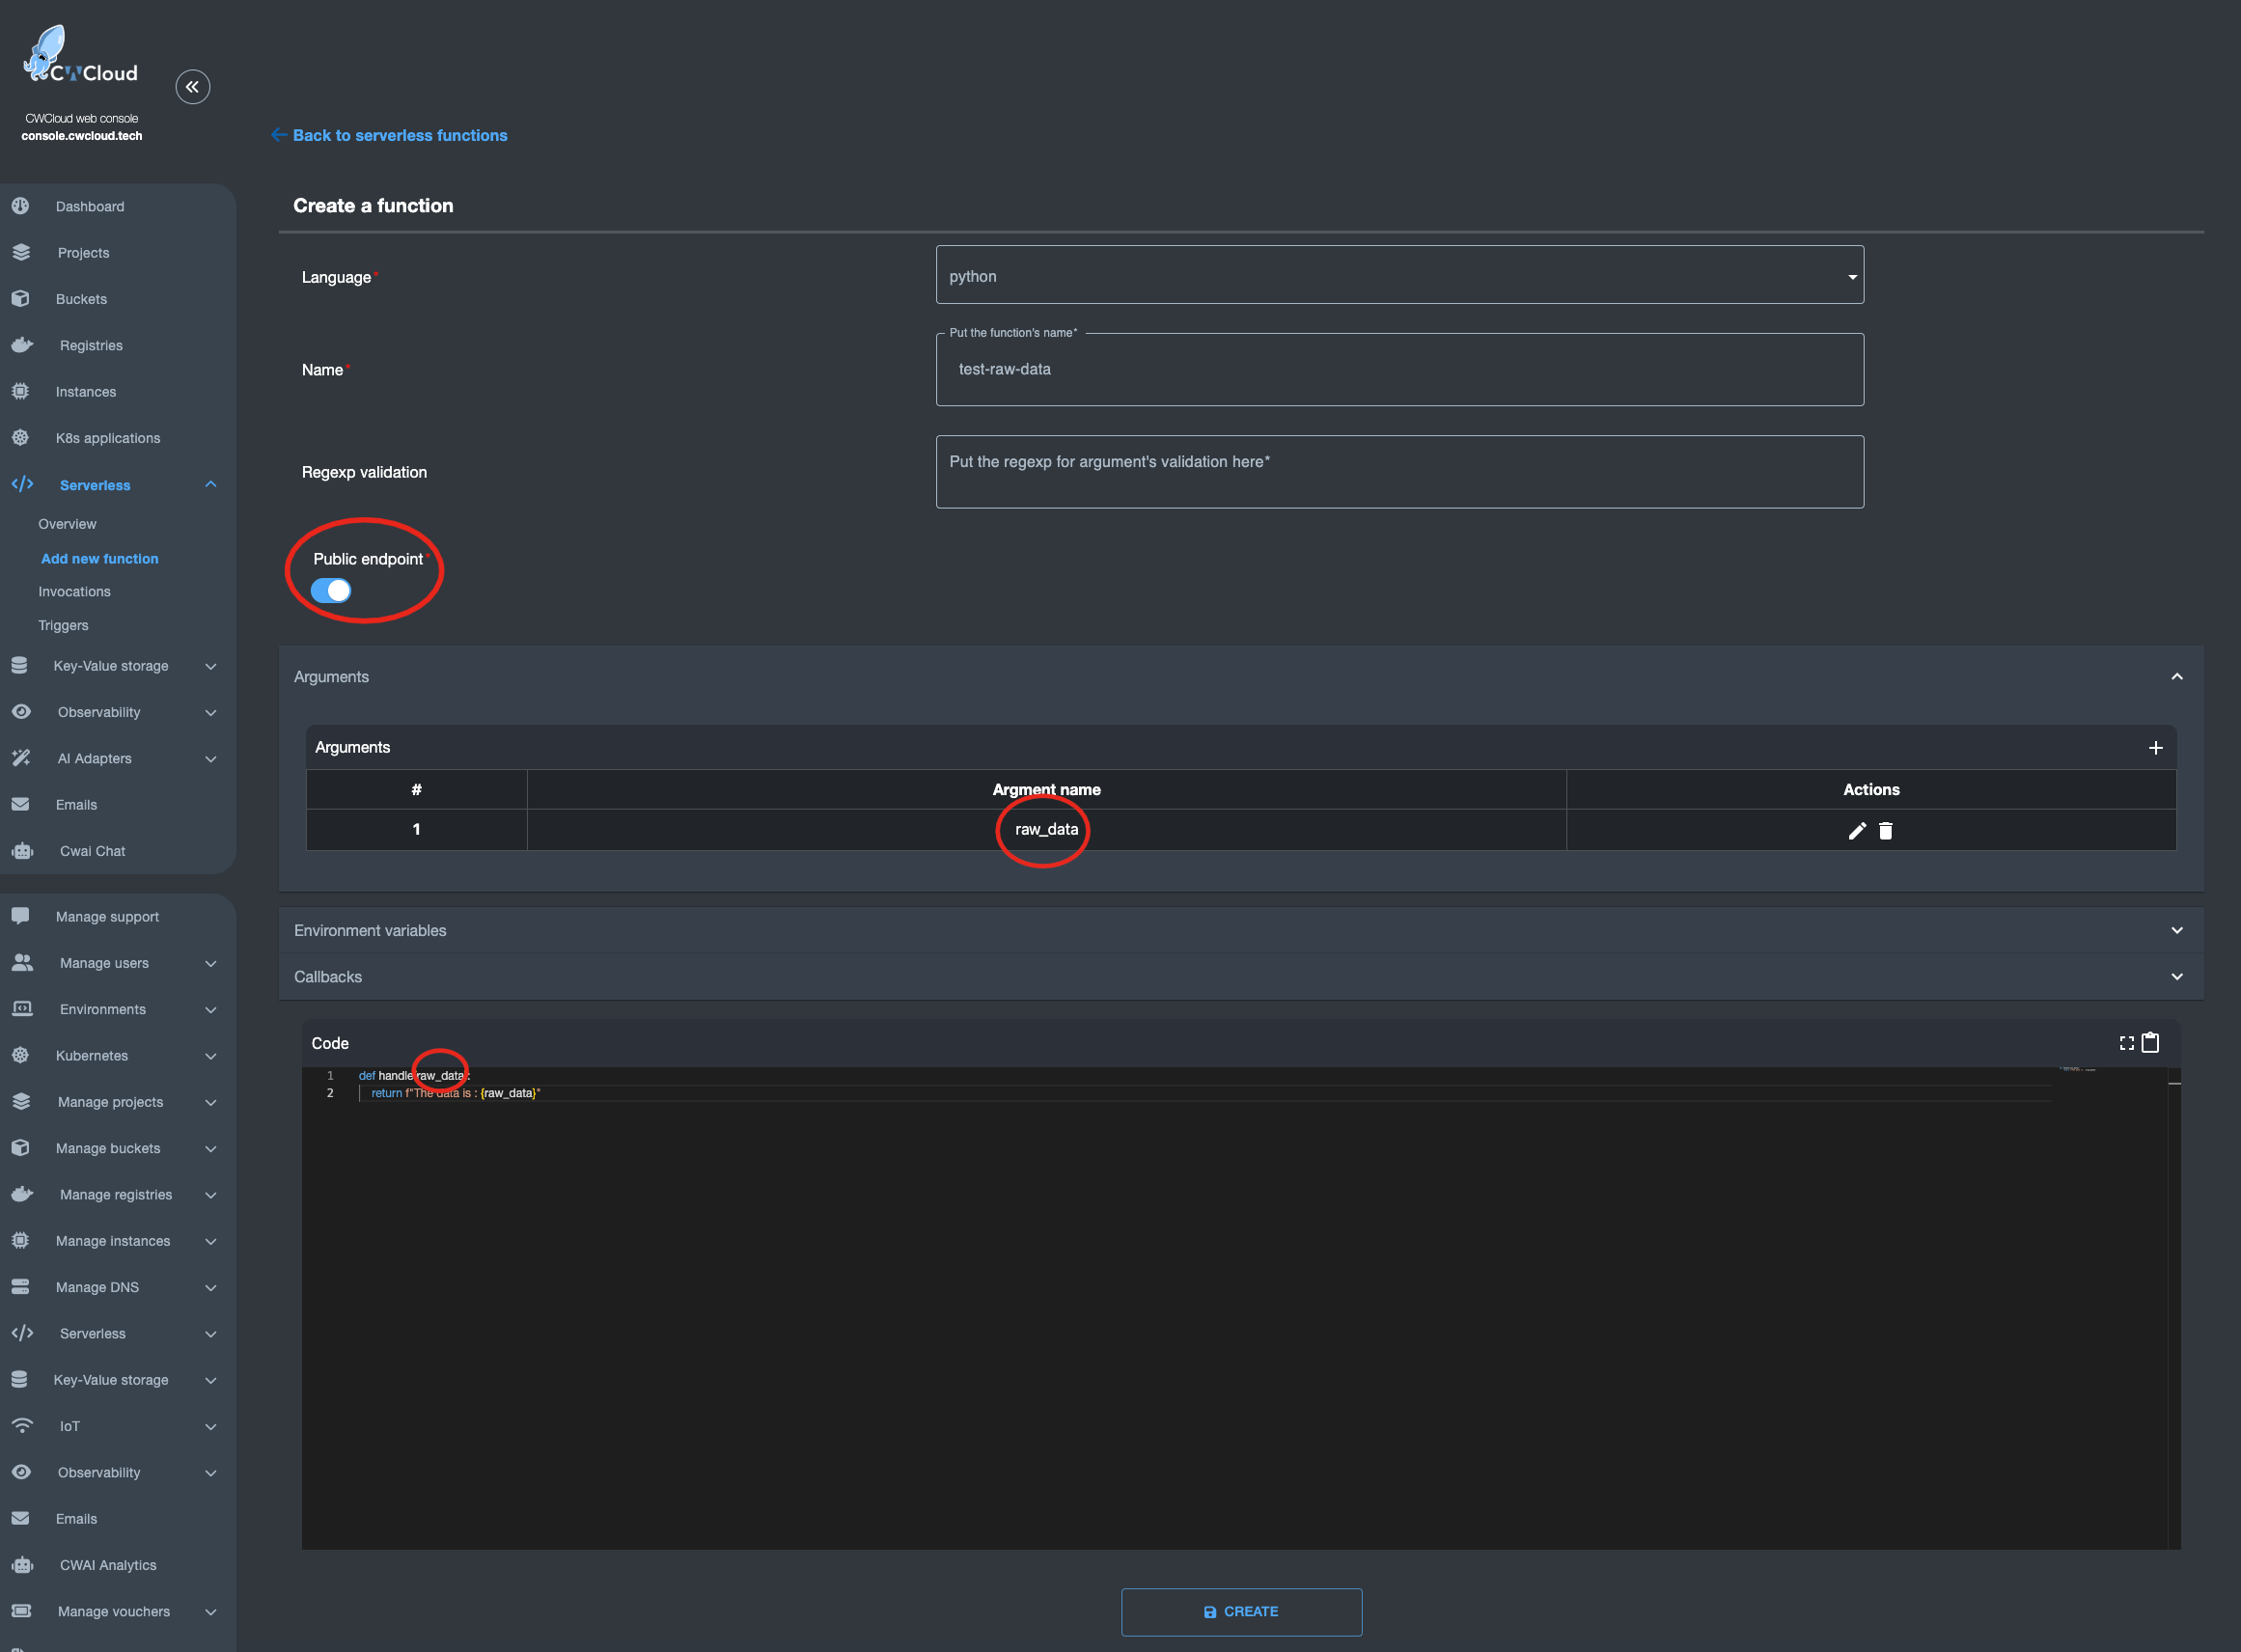
However, there is an endpoint /v1/faas/webhook/{function_id} (or /v1/faas/webhook/{function_id}/sync if you want to receive the function’s response directly in the HTTP response). In this case, your function just needs to be defined with a single raw_data argument like this:

faas-raw-data-arg

Once that’s done, it becomes very easy to invoke the function by passing whatever body you want — which you can then parse directly in your code:

$ curl "https://api.cwcloud.tech/v1/faas/webhook/ecb10330-02bf-400b-b6a8-d98107324ac3/sync" -X POST -d '{"foo":"bar"}' 2>/dev/null | jq .
{
"status": "ok",
"code": 200,
"entity": {
"id": "78774026-f75e-4c7c-850a-9b9eb2cb2ec0",
"invoker_id": 3,
"updated_at": "2025-07-05T14:39:53.119780",
"content": {
"args": [
{
"key": "raw_data",
"value": "{\"foo\":\"bar\"}"
}
],
"state": "complete",
"result": "The data is : {\"foo\":\"bar\"}\n",
"user_id": null,
"function_id": "ecb10330-02bf-400b-b6a8-d98107324ac3"
},
"created_at": "2025-07-05T14:39:52.443918"
}
}

As you’ve probably guessed, in the Health Auto Export app automation, it’s a URL like https://api.cwcloud.tech/v1/faas/webhook/{function_id} that you’ll need to define (no need for /sync at the end since you don’t care about waiting for the result).

Note: We also exposed the function as public so it could be called without authentication, but that’s not necessarily what you want. Don’t forget that you’re billed per token consumed — for example, if you use public LLMs — so you probably don’t want just anyone calling your webhook. You can totally keep the function private and add an X-User-Token header in the Health Auto Export app automation.

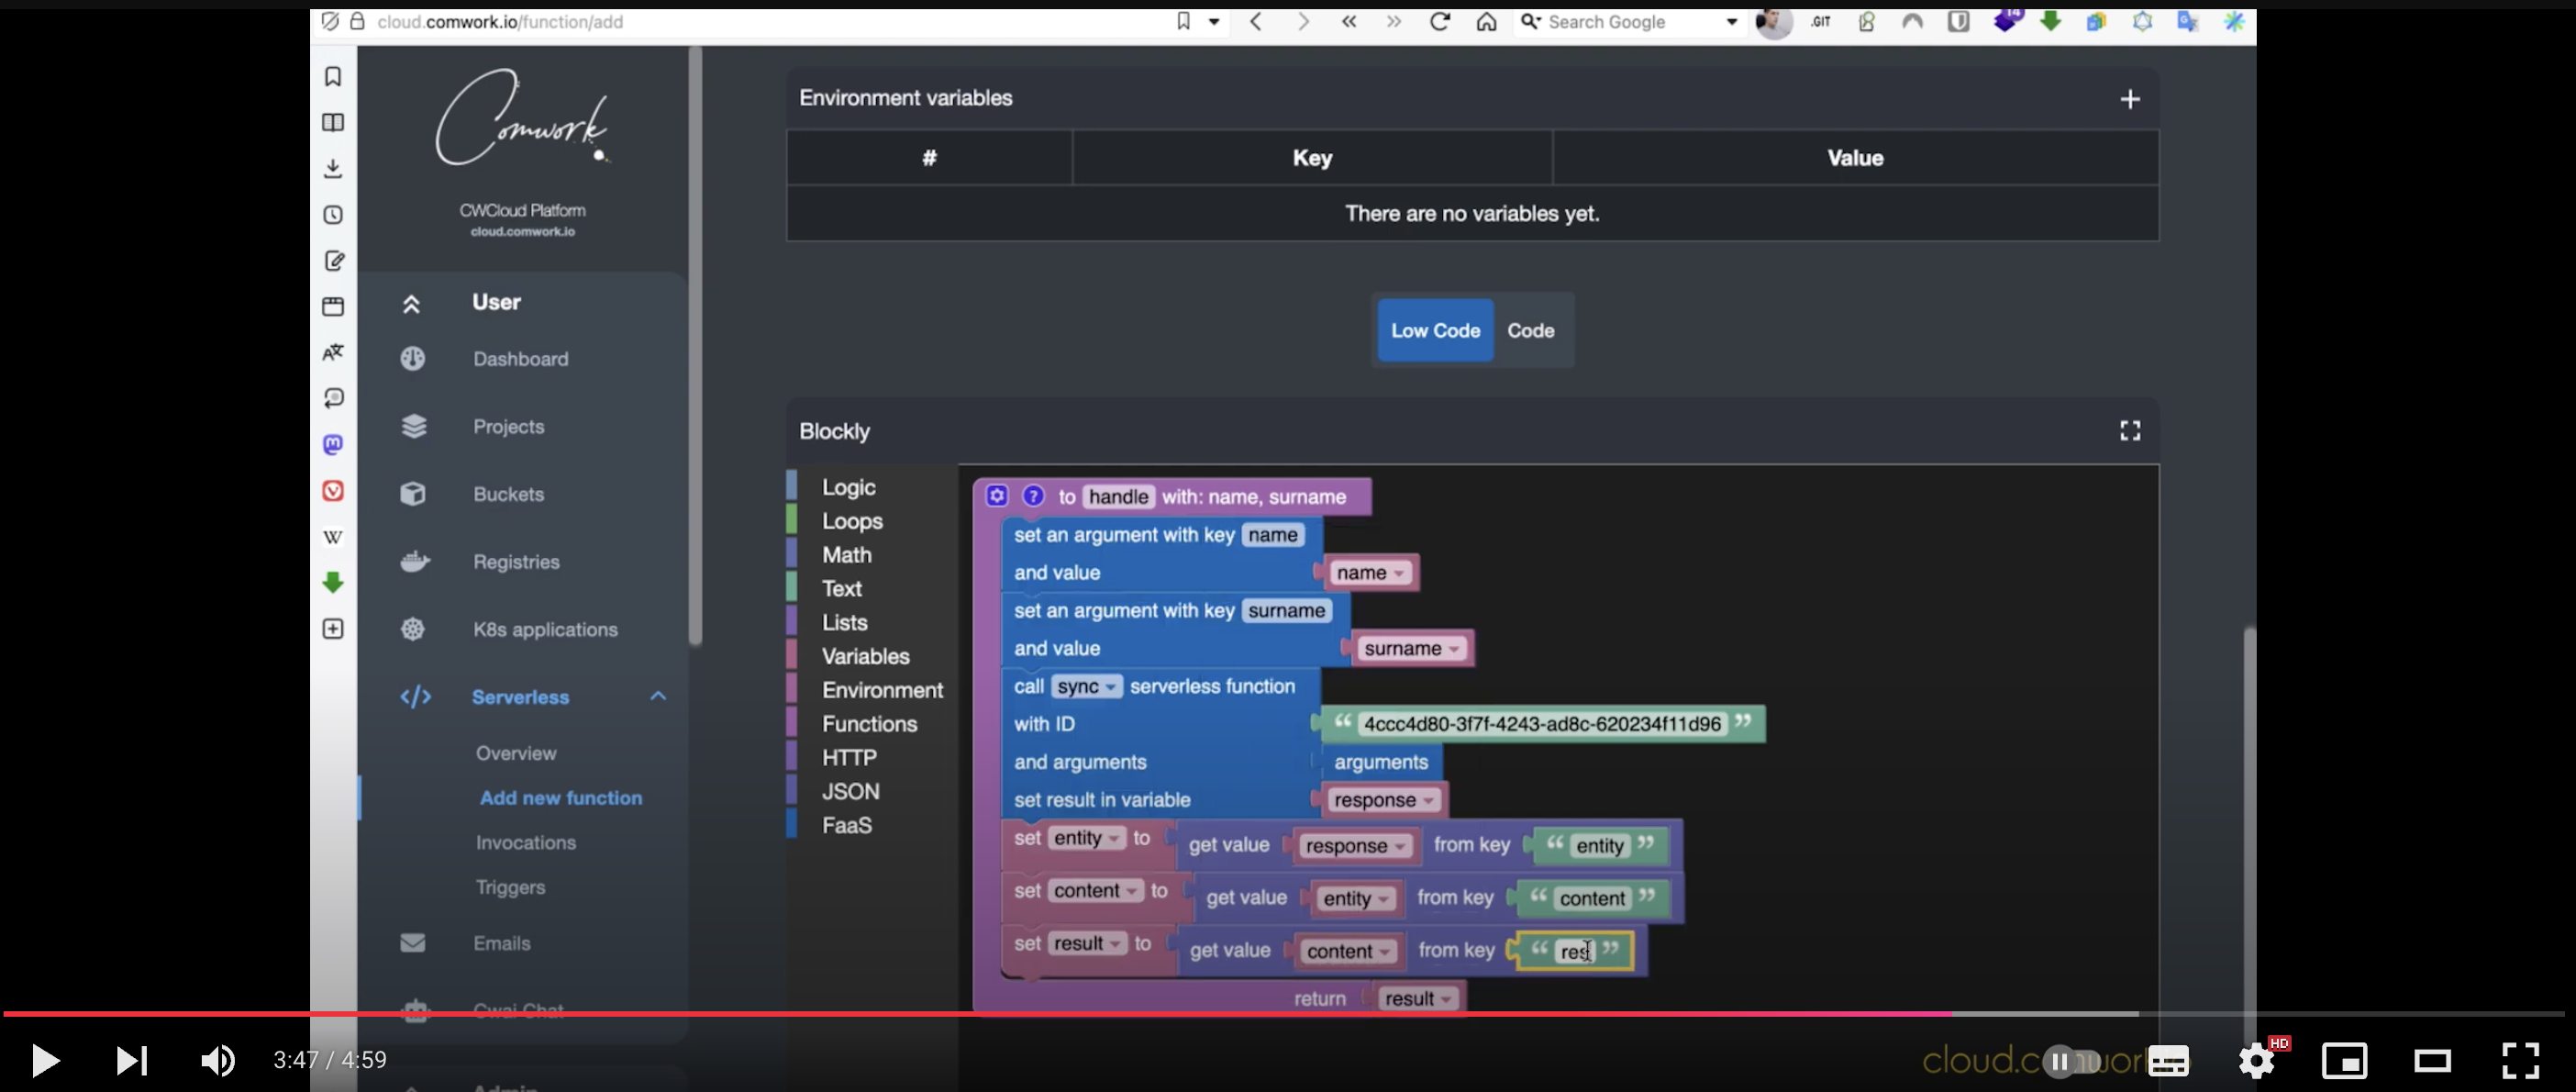
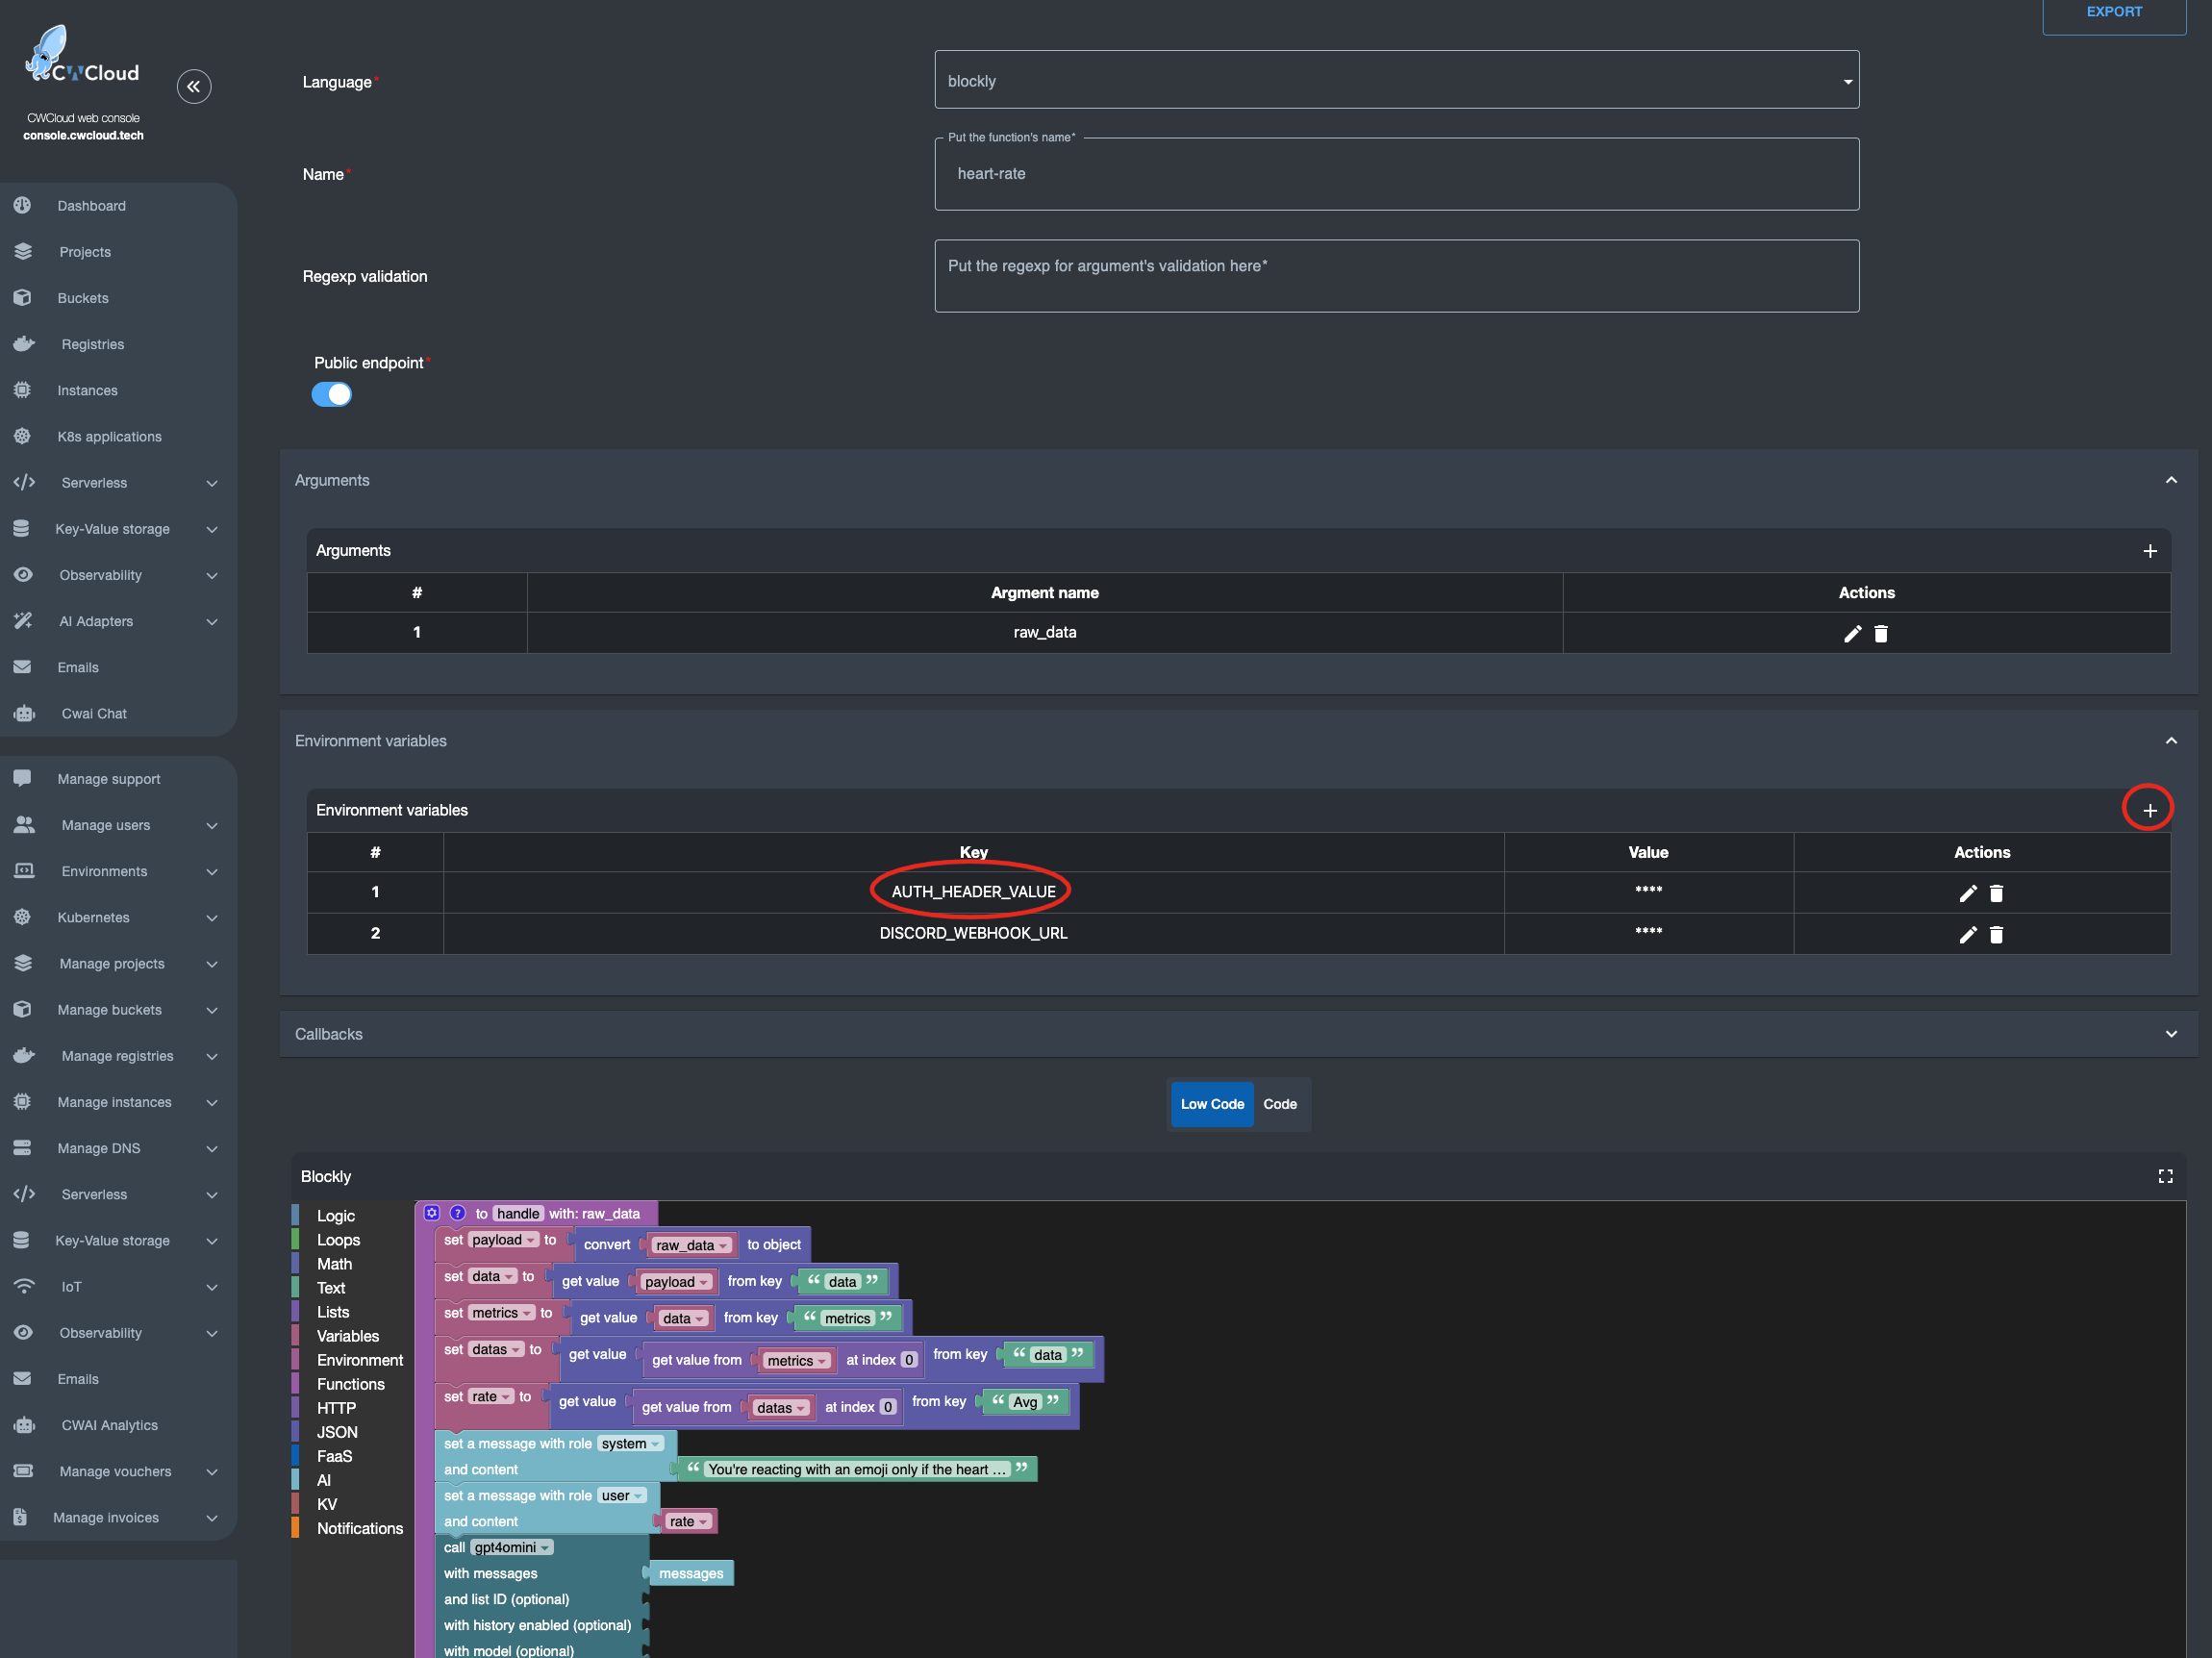
Now that we know how to create a webhook, here’s the Blockly3 code to extract the average heart rate, send it to the gpt4omini LLM. In this case, we asked the LLM to react with an emoji based on the value it receives, and send the result to Discord:

faas-blockly-heart-rate

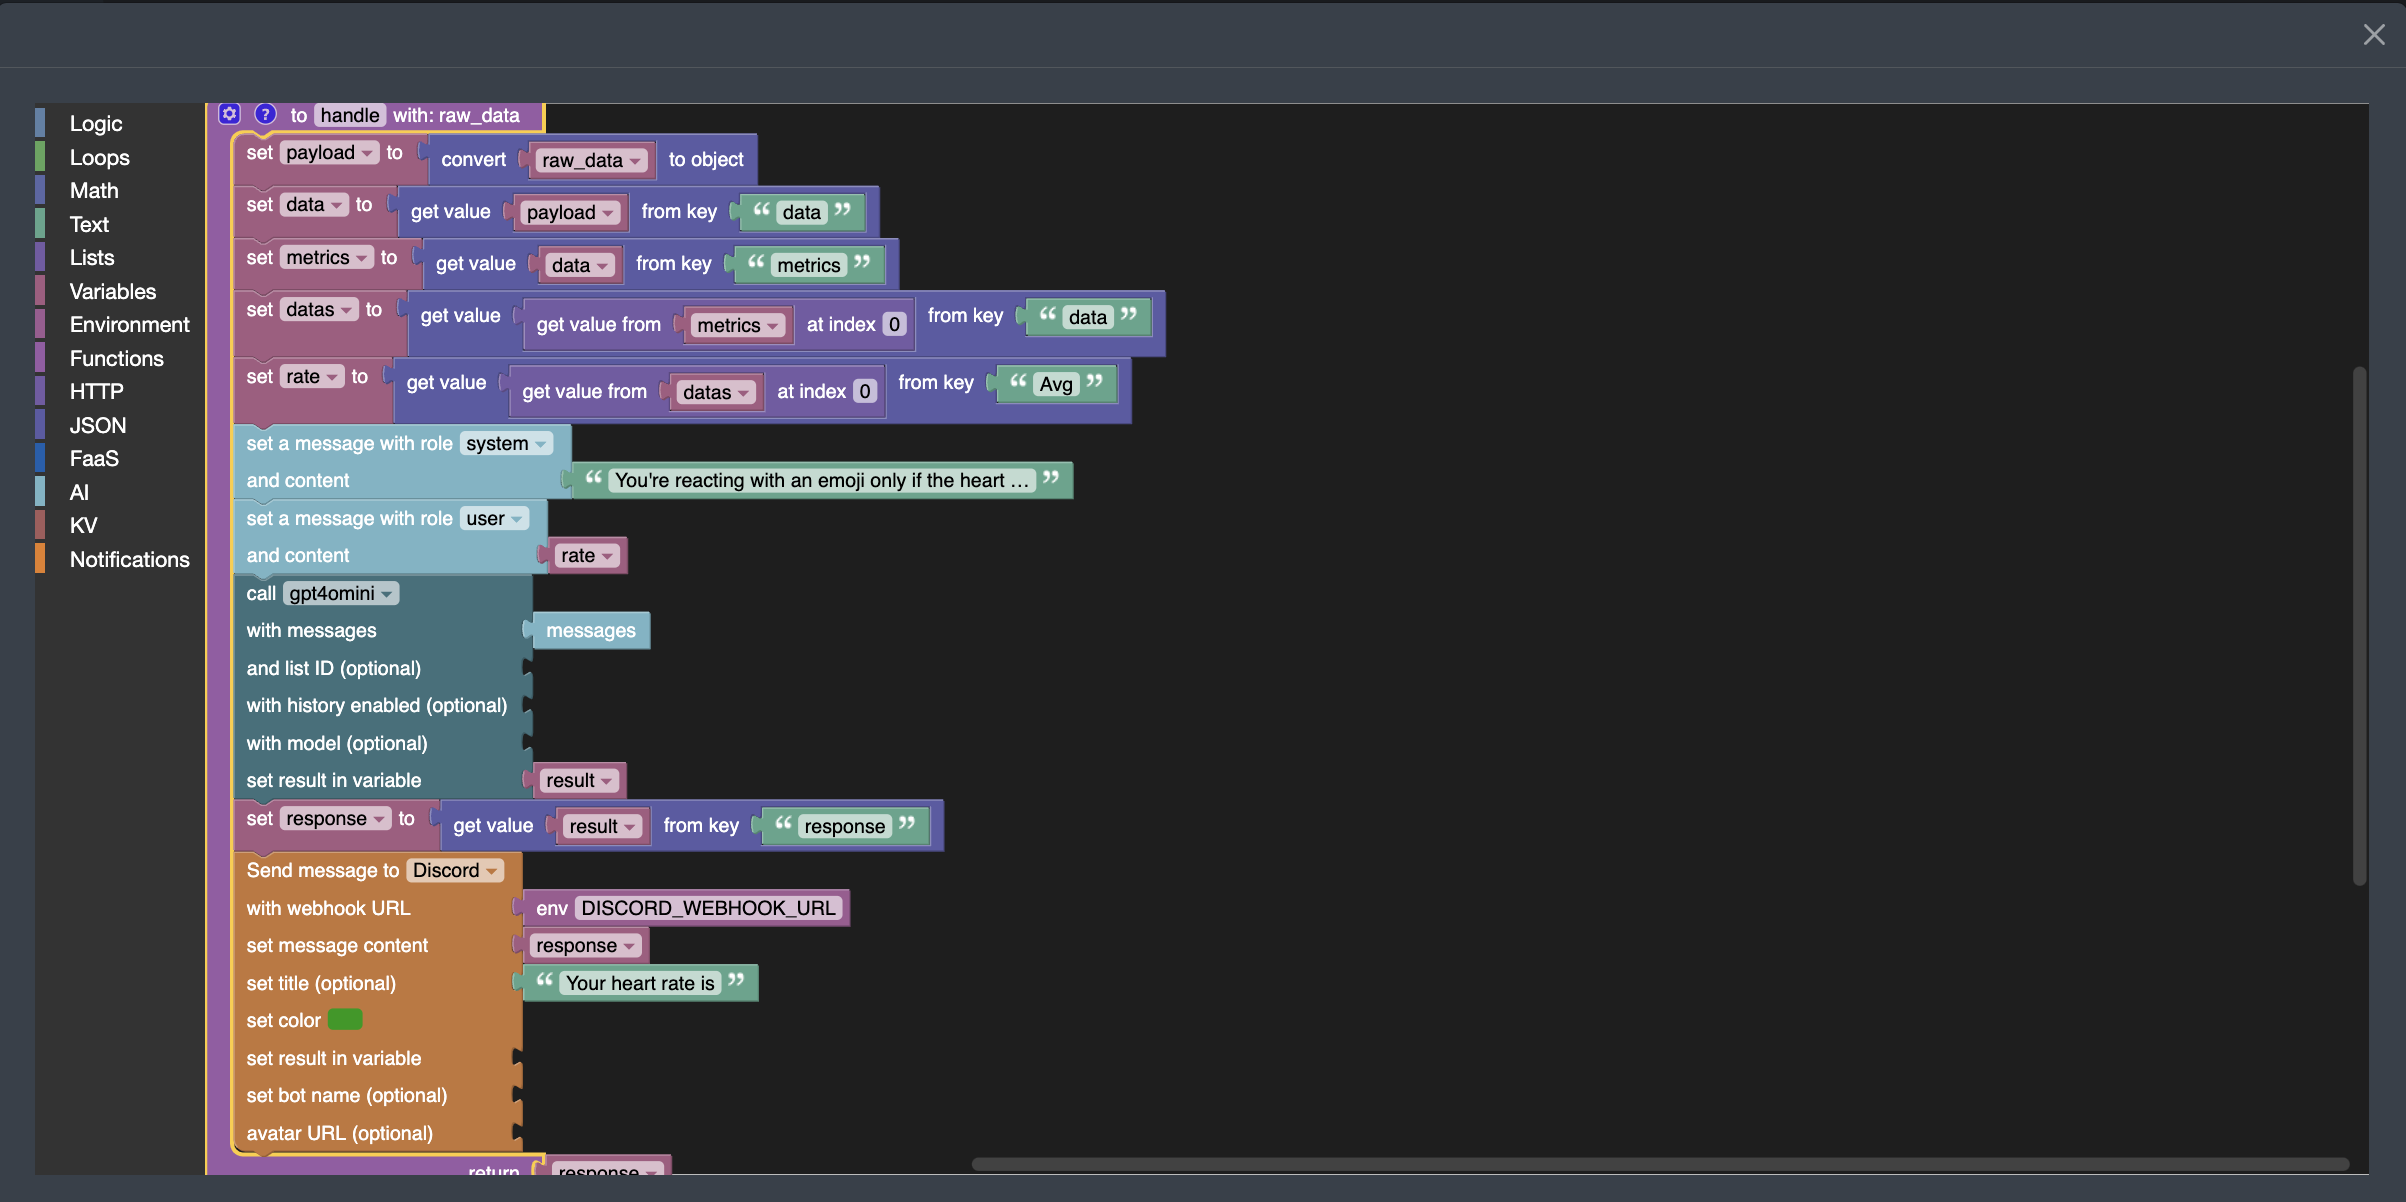
You can see that I'm passing the following sentence "You're reacting with an emoji only if the heart rate is too slow or to high" as a system prompt and the fetched heart rate metric as a user prompt.

Moreover, you should know that AI blocks require authentication to invoke the CWCloud AI API. If you want to keep this webhook open to anyone, you’ll need to create an API key following this tutorial, and inject it into an environment variable called AUTH_HEADER_VALUE like this:

faas-authentication-cwai

In this case, anyone is able to invoke your webhook and your account will be billed for usage in the case you’re using public AI models. You can also choose to use your own LLM hosted on your own infrastructure instead — in which case it makes more sense to keep the webhook public 😇.

Also note: if the AUTH_HEADER_VALUE variable is set, it takes priority over user authentication when calling the webhook with an authenticated request.

You can also see in the screenshot above that a Discord webhook was defined in another environment variable DISCORD_WEBHOOK_URL so it can be used to send the LLM’s response into Discord. Here’s the result:

faas-discord-heart-rate

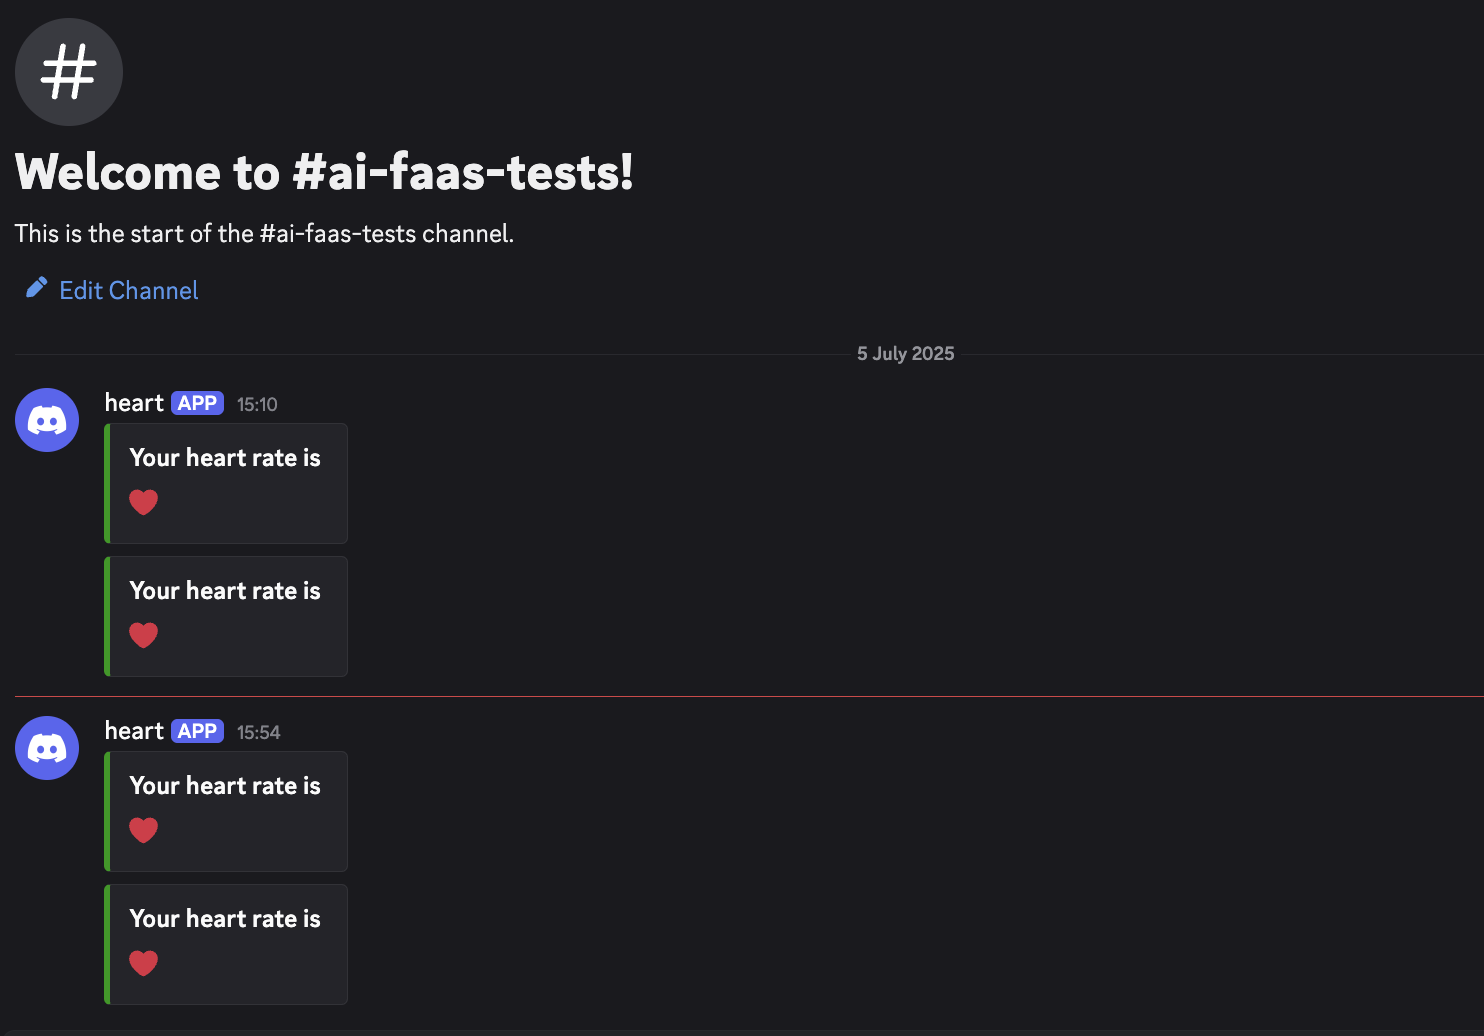
We can see that so far, everything’s going just fine with my heart 😅

Footnotes

  1. Function as a Service

  2. Large Language Model

  3. Blockly is low-code language we're providing with CWCloud

Technical Debt: When to Pay It Off and When to Live With It

· 8 min read
Ayoub Abidi
full-stack developer

Technical debt is a concept known by almost every software development team. Just like financial debt, technical debt increase over time, making the codebase more and more difficult and expensive to maintain.

technical-debt

This article will present the nuances of technical debt management, focusing specifically on when you should prioritize paying it down and when it might be reasonable to live with it. We'll examine concrete indicators, practical strategies, and real-world scenarios that could help development teams make relevant decisions about their technical debt.

TL;DR

Technical debt is similar to any other debt: it's not necessarily bad, but is becoming dangerous if ignored. You should accept it wisely, track it clearly, and pay it off when the cost of keeping exceed the benefit.

In other words: write fast but refactor smart.

Understanding Technical Debt

Before deep diving into the various management strategies, it's important to understand that technical debt can take multiple forms. Here's some of them.

Code-level debt

Suboptimal code patterns, duplicate code, violations of best practices...

Example: code duplication

function checkUserEmail(email) {
return /^[^\s@]+@[^\s@]+\.[^\s@]+$/.test(email);
}

function validateAdminEmail(email) {
const emailRegex = /^[^\s@]+@[^\s@]+\.[^\s@]+$/; // Duplicated logic
return emailRegex.test(email);
}

⬇️

// Better approach would be:
function validateEmail(email) {
return /^[^\s@]+@[^\s@]+\.[^\s@]+$/.test(email);
}

Architectural debt

Structural issues that affect the entire system, such as tight coupling between components or monolithic architectures that should be modular.

Documentation debt

Missing, outdated, or inadequate documentation.

Test debt

Non-sufficient test coverage, or overly complex test suites.

Infrastructure debt

Outdated dependencies, deployment processes, or development environments.

Technical debt is inevitable in most software projects. The key ain't to eliminate it entirely (that obviously not possible in the real world) but to manage it strategically.

When to Pay Off Technical Debt

When It Directly Impacts User Experience

If technical debt is causing visible issues for end users, such as slow performances, frequent crashes, or security vulnerabilities it should be addressed immediately. Those issues directly affect your product's reputation and user experience.

Example: Performance debt affecting user experience

// Before: Inefficient API calls causing lag
async function loadDashboard() {
const userData = await fetchUserData(); // 500ms
const statsData = await fetchStatsData(); // 700ms
const notifData = await fetchNotifData(); // 600ms
// Total: ~1800ms (sequential calls)

renderDashboard(userData, statsData, notifData);
}

⬇️

// After: Optimized parallel API calls
async function loadDashboard() {
const [userData, statsData, notifData] = await Promise.all([
fetchUserData(),
fetchStatsData(),
fetchNotifData()
]);
// Total: ~700ms (parallel calls)

renderDashboard(userData, statsData, notifData);
}

When Development Velocity Is Decreasing

If your team is spending way more time working around technical issues in the codebase than bringing new features, it's a strong signal that technical debt is eating your velocity. Track those metrics over time:

  • Time spent on bug fixes vs. new feature development
  • Average time to implement new features
  • Frequency of unexpected issues during deployment

When these metrics show a negative trend, it's the time to allocate resources to paying down debt.

When Adding New Features Suddenly Becomes Excessively Complex

If seemingly simple features require disproportionate effort due to the complexity of the codebase, technical debt is likely the culprit. This is particularly evident when:

  • Simple changes require modifications in multiple places
  • Adding new functionality requires extensive understanding of unrelated parts of the system
  • Developers consistently underestimate the time required for new features (Trust me, whether you’ve been coding since floppy disks or the cloud was just literal water vapor, your estimates will still be hilariously wrong)

When Onboarding New Team Members/Interns Takes Too Long

If new developers struggle to understand the codebase and are able to contribute and fix issues in a reasonable time, it could indicate excessive technical debt. Don't understimate the power of a clean, well-structured codebase with appropriate documentation. It will accelerate onboarding and reduce the learning curve exponentially.

You Are Scaling

What worked for 100 users may fall apart at 1000. Scalability is one of the top reasons to pay off infrastructure or architectural debt.

When to Live With Technical Debt

When Time-to-Market Is Critical

In highly competitive markets or when working against tight deadlines, accepting some technical debt might be necessary to ship products on time. This is especially true for startups or new products where market validation is far more important than perfect code.

Example: Expedient MVP implementation with acknowledged debt

/*
TODO: Technical Debt - Current Implementation
This is a simplified implementation to meet the MVP launch deadline.
Known limitations:
- No caching mechanism (could cause performance issues at scale)
- In-memory storage (will need DB implementation for production)
- No error handling for network failures
*/

async function fetchProducts() {
// Simplified implementation for MVP
let products = {};
const response = await fetch('/api/products');
const data = await response.json();

data.forEach(item => {
products[item.id] = item;
});

return Object.values(products);
}

When the Code Is in a Rarely Changed Area

Not all parts of a codebase are created equal. Some modules or components rarely change after initial development. Technical debt in these stable areas might not be worth addressing if they work correctly and don't affect the rest of the system.

When the Cost of Fixing Exceeds the Benefits

Sometimes, the effort required to fix technical debt outweighs the benefits. This is particularly true for:

  • Legacy systems approaching retirement
  • Code that will soon be replaced by a new implementation
  • Non-critical features with limited usage

When Technical Debt Is Isolated

If the technical debt is well-contained and ain't affect other parts of the system, it becomes acceptable to live with it and ain't become the end of the world and hands of destruction 😜.

When Your Team Is Undergoing Significant Changes

During periods like team transitions, onboarding multiple new members, or dealing with organizational restructuration, maintaining stability might be more important than paying down technical debt. You should wait for a period of team stability before tackling significant refactoring efforts.

Practical Strategies for Technical Debt Management

Allocate Regular Time for Debt Reduction

Many successful development teams allocate a fixed percentage of their time (e.g., 20%) to addressing technical debt. This creates a sustainable approach to debt management without sacrificing feature development.

Practice Continuous Refactoring

Instead of large, risky refactoring, incorporate continuous refactoring into your development workflow. This reduces the risk and makes debt reduction more manageable.

Documentation

Use TODOs, comments, or issue trackers to record what was done and why. Don’t let debt hide.

Measuring the Impact of The Technical Debt

In order to make relevant decisions about technical debt, you need to measure its impact. Here are concrete metrics to track.

Development Velocity

Track how long it takes to implement similar features over time.

Code Churn

Measure how frequently code changes in specific areas.

Build and Deployment Metrics

Track build failures, deployment issues, and rollbacks.

Static Analysis Results

Use tools in your pipelines workflow like Ruff, Bandit, or ESLint to identify code quality issues.

Real-World Case Studies

Case Study 1: Etsy's Continuous Deployment Revolution

Etsy faced significant technical debt in their deployment process, with infrequent, painful deployments that slowed innovation. Instead of a massive overhaul, they gradually transformed their process:

  1. They introduced automated testing and continuous integration
  2. They focused on small, incremental improvements to their deployment pipeline
  3. They built tools to increase visibility into the deployment process

This gradual approach allowed them to move from deployments every few weeks to multiple deployments per day, without disrupting their business operations.

Case Study 2: Twitter's Rewrite of Their Timeline Service

Twitter's timeline (a.k.a X now) service accumulated significant technical debt as the platform grew. They decided to rewrite it completely, but did so incrementally:

  1. They built the new system alongside the old one
  2. They gradually moved traffic to the new system
  3. They maintained backward compatibility throughout the transition

This approach allowed them to replace a critical service without any disruption of the user experience.

Conclusion

Most of the time, the successful approach to manage technical debt is a balanced one: allocate regular time for debt reduction, establish clear metrics for tracking debt, and build a culture that values code quality alongside feature delivery.

Remember that the goal ain't getting the perfect code, but a codebase that enables your team to deliver value to users efficiently and sustainably. By making informed decisions about when to pay off technical debt and when to live with it, you can strike the right balance between speed and sustainability in your development process.

References and Further Reading

Fork It Tunisia 2025, day summary

· 2 min read
Idriss Neumann
founder cwcloud.tech

We made it! Tunisia 🇹🇳 had his first developer and tech conference at the city of culture on the 5th of April.

forkit-tn-2025-hall

As we planned with a previous blogpost we had a beautiful booth in order to challenge attendees with a AI, serverless and IoT competition. We had lot of contenders who participated.

forkit-tn-2025-cwcloud-booth

Let's congratulate again the winners: Zayneb, Ala Eddine and Yassmine1!

forkit-tn-2025-winners

The source code of the challenge is available on github and if you want more explanation, you can watch this short video (you can enable the English subtitles):

forkit-cwcloud-challenge

I also had the chance to get on stage and talk about Quickwit, Grafana, Jaeger and OpenTelemetry with another demo. It was planned to be in English but finally the public wanted to be in French. Sorry for those who want to get an English replay, there'll be other occasions 😅

forkit-tn-2025-talk-quickwit

There will be a replay, the slides and materials are available on github as well and if you want to get more informations about it, you can read this blogpost.

I also attended the great and inspiring keynote "how do you learn" with Olivier and Sonyth Huber and recommand you to watch the replay when it will be published.

And finally I also get my speaker friend Yacine to Sidi Bou Saïd, the most beautiful place in Tunis area. Yacine who also gave an amazing conference about how he ported Doom on a web browser using WASM (WebAssembly) which is an amazing technology.

forkit-tn-2025-sidibou

Now if you want to stay in touch especially if you enjoyed the CWCloud's demo and competition, we have a community discord server you can join.

Next events for me will be DevoxxFR as an attendee, SunnyTech and RivieraDev as a speaker. I hope to see many of you there 🤩.

Footnotes

  1. Yassmine couldn't stay to get the prize so her friend took it for here 😅.

Fork It Event in Tunis

· 2 min read
Idriss Neumann
founder cwcloud.tech

As you might know we will be present in the Fork It Event which will happened in Tunis 🇹🇳 on the 5th of April.

CWCloud will have a booth with an AI, IoT and serverless challenge which will consist to read a DHT22 humidity and temperature sensor with a Raspberry Pi then send the temperature to a CWCloud serverless and lowcode function which will send it to a LLM in order to make it react with emojis. You'll get more informations with this video:

forkit-cwcloud-challenge

Note: the video is in French but you can enable the English subtitles :p

There will be prizes to win like on of the Aurélie Vache's book:

aurelie-books

I'll also present the following talk at 04:55 PM: Let's discover together the next generation of observability with logs and traces: Quickwit.

It's very important to register quickly and get your ticket here. It's not expensive at all for an event of this quality and we also got a discount code for our readers which will lower the price by 20%: COMWORK20.

In order to register, you have to click on "Get Tickets":

forkit-get-tickets

Then you have to choose one of the available currency you can use with a credit card (Euros or TND):

forkit-choose-currency

If you're using tunis.events with the TND currency, in order to add the discount code, you can click on "code secret" (which means "secret code"):

forkit-ticket-tnd

And if you're using lu.ma with the Euros currency, in order to add the discount code, you can click on "add a coupon":

forkit-ticket-euros

We hope that many of you will join us there!

New identity for CWCloud

· One min read
Idriss Neumann
founder cwcloud.tech

new-identity-cwcloud

You may have noticed that we have changed our visual identity and started separating activities. CWCloud is becoming a standalone product with its own legal structures currently in progress (until it's done, the product remains under the supervision of the company Comwork).

On this occasion, CWCloud has its own landing page, and the blog has been moved here: cwcloud.tech.

Comwork will continue to exist as a service-oriented company with its own website, which remains: comwork.io.

Many things are evolving, including the introduction of two versions: a Community Edition (open-source under the MIT license) and an Enterprise Edition (proprietary), with additional features meant for large organizations. The SaaS versions for the European/international and Tunisian markets will directly point to the Enterprise Edition.

We're also applying to YCombinator's finance program to help further develop the product. We will keep you updated on our progress.

DevOps is dead, is it serious doctor?

· 7 min read
Idriss Neumann
founder cwcloud.tech

Happy new year everyone 🎉 . Let's start this new year with a new retrospective about DevOps.

There's already a lot of articles and blogposts1 which explains in detail what DevOps is, so I'm going to go over it very quickly in order to be sure that we're on the same page when we're talking about DevOps in this article.

So basically DevOps is a strategic alignment between the stackholders who develop a product and its features (the build) and those who maintain the production (the run). We're supposed to measure the application of DevOps by the success in breaking down the frontiers (or silos) existing between the build and run in a company or organization.

For quite some time now, the DevOps word has drifted away from its original intent by recruiters to directly refer to some technical skills2 which can be valuable assets in oder to implement it. That's why we can read so many "DevOps evengelists" shouting that "devops ain't a role, it's a set of good practices which help to break down silos", and they are right from an evengelist perspective.

However, I personally found as a tech manager which wants to provide tools and technical skills, that we should accept it and comply nowadays. That's why I don't have any issue with adding the DevOps word on CVs or job offers when it comes to select profiles whose role corresponds more to either SRE3 or Platform Engineers. Same thing for tools we're developing like CWCloud. I think the more important thing is to answer the customer's needs. So if they think that DevOps is a set of technical skills, then it's not a serious issue, let's start by approaching them because we're relevant to help rather than correcting them in a dogmatic way.

Moreover, to illustrate this even more, let's see how GitLab is presenting itself:

GitLab: The most-comprehensive AI-powered DevSecOps platform

Before the AI hype, it was defined during years as the complete DevOps toolchain despite the fact that git repositories, CI/CD and GitOps capabilities ain't DevOps and lot of companies which are using GitLab aren't following the DevOps principle at all. I personnaly think it should be the same for people who can help to automate some deployments automations using tech skills like ansible, terraform, helm, whatever.

That been said, let's go back to the point of this blogpost: I personnaly think that DevOps is dead and we're back to the silos like every decades in all the industries which are growing and in this case, because of the move to modern cloud.

First, let's define what modern cloud is: it's basically a matter of providing a layer of abstraction of the complexity of infrastructures via user-friendly APIs which can be directly consumed by product owners, developers, datascientists... in short, stackholders who ain't skilled enough in the field of hosting and managing their apps in production. And those API with different level of abstractions are provided As a Service4.

The modern cloud is now a service which can be externalized using public cloud (by public cloud providers like AWS, GCP, Azure, Scaleway, whatever) or private cloud using modern tools like OpenStack, OpenShift, Kubernetes, FaaS platform... any kind of tools which aims to provide the features teams some sort of autonomy in the deployment of their code.

And that's why, we're assisting to the rize of the silos again:

  • teams of Platform Engineers which are providing the tools to help the developers to deploy their code (images registries, CI/CD pipelines capabilities, serverless engines, observability tools...)
  • teams of SRE5 which are most of the time former developers taking care about the incident in production and giving the information on how to solve those incident in the short term and long term including patching the code directly
  • teams of consumers (developers, product owners, datascientists...) of the platform6
  • teams of OPS who are taking care of the physical infrastructure: hardware, network, low-level system administration

Moreover, the only difference between public cloud and private cloud is the fact that some of the stakeholders from those silos are directly working as employee of the cloud provider. Basically it's a matter of mutualizing human resources in large scale organizations which haven't been really compliant with DevOps since the begining.

So ain't it looks like what we had before the hype of DevOps? What are the differences?

The only difference is in fact the SLA7 and the time to market were really bad for various reasons:

  • lacks of agility in the planing of the different teams which weren't aligned
  • some people were some sort of bottleneck because of a lacks of automation and abstraction
  • former corporate practices frameworks like ITIL or CMMI which were solving everything with ITSM8

And as for the agile methodologies before, DevOps was too much oriented on breaking down the silos which is impossible for every large scale organizations. And because the purpose of any kind of company is to grow, it wasn't a sustainable solution. Methodologies which ain't scalable ain't sustainable at the end.

That been said, is it really an issue if we go back to former silos? I think not, like Agile (and even ITIL, CMMI, COBIT, DDD, TDD, whatever), we're improving by cherry-picking some principle of those methodologies and frameworks when we need it. Of course, we'll continue to improve in the fields of automation, CI/CD, observability and improve our SLA in the incident resolution and our time to market for evolutions using pragmatic engineering, not by religiously following methodologies. Dogmatism and pragmatism are often inherently opposed and as engineers we should stick to pragmatism and focus on solving issues with the best ROI9.

So again, happy new year and let's hope that 2025 will be a new era of improvement. We have plenty of surprises coming in terms of observability and automation (maybe using AI 😱).

Footnotes

  1. If you're a French speaker, I like very much this article from Katia Himeur Talhi for example. Otherwise, you can ask directly chatGPT for this kind of things, it'll write a similar article that will probably looks like lot of blogpost on the web 🥹

  2. CI/CD pipelines, deployment automations, observability, scripting...

  3. System Reliability Engineer. If you're not familiar with this concept, I advise you again to read the Katia's article if you can read it or ask chatGPT otherwise 😛

  4. That's why we're often talking about IaaS, PaaS, DaaS, CaaS, FaaS...

  5. We can see that this team is often the same people who are also doing platform engineering two different roles and purpose but same technical skills so same people ultimately

  6. In the ideal world, those people are supposed to consume directly the platform API's: setting up their Dockerfiles, their CI/CD pipelines... But it's sometimes deleguated to the platform engineers teams for various reasons. For example they might have not enough time to take care of this work or it's still too complicated... I think this issue will be solved with more abstraction, automation and AI because most of the time, those kind of configurations are repetitive and redundant everywhere in the end. And that's also why we're developing CWCloud 😜

  7. Service Level Agreement

  8. Information Technology Service Management. Basically, operating everything, every department, every people with a ticket tools like Jira, Asana, Mantis, whatever

  9. Return of Investment

Replace Google Analytics with Grafana, Quickwit and CWCloud

· 6 min read
Idriss Neumann
founder cwcloud.tech

Hi and Merry Christmas 🎄 (again yes, I didn't thought that I was going to publish another blogpost so soon 😄).

In this blogpost we'll see how to use CWCloud and Quickwit to setup beautiful dashboards like this in replacement of Google Analytics:

grafana-geomap-dashboard

Before going in detail, let's start to give you a bit of context of what brought us to do this transition.

First, Google Analytics ain't comply with the GDPR1. So basically it was becoming illegal to continue to use it despite it was an amazing tool to analyze our websites and application usages.

With the last case law, we started to use Matomo as a replacement and we're still providing Matomo as a Service in our CWCloud SaaS. And it worked pretty well (even if I find the UI a bit old-fashion)...

However I didn't like to maintain multiple stacks which, from my perspective, are serving the same purpose: observability. And yes web analytics should be part of it from my perspective.

I already explained why we choosed Quickwit as our observability core stack in previous blogposts:

So the idea was to use the same observability stack to track visitors data and index and display those on Grafana. And to be able to achieve this, we needed something very easy to add in our various frontend like a one-pixel image:

<img src="https://api.cwcloud.tech/v1/tracker/img/{mywebsite}" style="display: none;"></img>

As you can see, we provided it as an endpoint in CWCloud to complete the observability features and it's documented here.

This endpoint is writing a log which looks like this:

INFO:root:{"status": "ok", "type": "tracker", "time": "2024-12-20T13:46:23.358233", "host": "82.65.240.115", "user_agent": "Mozilla/5.0 (iPhone; CPU iPhone OS 18_1_1 like Mac OS X) AppleWebKit/605.1.15 (KHTML, like Gecko) Version/18.1.1 Mobile/15E148 Safari/604.1", "referrer": "https://www.cwcloud.tech/", "website": "www.cwcloud.tech", "device": "mobile", "browser": "safari", "os": "ios", "details": {"brand": "apple", "type": "iphone"}, "infos": {"status": "ok", "status_code": 200, "city": "Saint-Quentin", "region": "Hauts-de-France", "country": "France", "region_code": "HDF", "country_iso": "FR", "lookup": "FRA", "timezone": "Europe/Paris", "utc_offset": "FR", "currency": "EUR", "asn": "AS12322", "org": "Free SAS", "ip": "xx.xx.xx.xx", "network": "xx.xx.xx.0/24", "version": "IPv4", "hostname": "xx-xx-xx-xx.subs.proxad.net", "loc": "48.8534,2.3488"}, "level": "INFO", "cid": "742b7629-7a26-4bc6-bd2a-3e41bee32517"}

So at the end, it contain a JSON payload we can extract and index:

{
"status": "ok",
"type": "tracker",
"time": "2024-12-20T13:46:23.358233",
"host": "82.65.240.115",
"user_agent": "Mozilla/5.0 (iPhone; CPU iPhone OS 18_1_1 like Mac OS X) AppleWebKit/605.1.15 (KHTML, like Gecko) Version/18.1.1 Mobile/15E148 Safari/604.1",
"referrer": "https://www.cwcloud.tech/",
"website": "www.cwcloud.tech",
"device": "mobile",
"browser": "safari",
"os": "ios",
"details": {
"brand": "apple",
"type": "iphone"
},
"infos": {
"status": "ok",
"status_code": 200,
"city": "Saint-Quentin",
"region": "Hauts-de-France",
"country": "France",
"region_code": "HDF",
"country_iso": "FR",
"lookup": "FRA",
"timezone": "Europe/Paris",
"utc_offset": "FR",
"currency": "EUR",
"asn": "AS12322",
"org": "Free SAS",
"ip": "xx.xx.xx.xx",
"network": "xx.xx.xx.0/24",
"version": "IPv4",
"hostname": "xx-xx-xx-xx.subs.proxad.net",
"loc": "48.8534,2.3488"
},
"level": "INFO",
"cid": "742b7629-7a26-4bc6-bd2a-3e41bee32517"
}

So let's start by creating the Quickwit mapping:

{
"doc_mapping": {
"mode": "lenient",
"field_mappings": [
{
"name": "time",
"type": "datetime",
"fast": true,
"fast_precision": "seconds",
"indexed": true,
"input_formats": [
"rfc3339",
"unix_timestamp"
],
"output_format": "unix_timestamp_nanos",
"stored": true
},
{
"indexed": true,
"fast": true,
"name": "cid",
"type": "text",
"tokenizer": "raw"
},
{
"indexed": true,
"fast": true,
"name": "website",
"type": "text",
"tokenizer": "raw"
},
{
"indexed": true,
"fast": true,
"name": "device",
"type": "text",
"tokenizer": "raw"
},
{
"indexed": true,
"fast": true,
"name": "os",
"type": "text",
"tokenizer": "raw"
},
{
"indexed": true,
"fast": true,
"name": "browser",
"type": "text",
"tokenizer": "raw"
},
{
"indexed": true,
"fast": true,
"name": "host",
"type": "ip"
},
{
"indexed": true,
"fast": true,
"name": "hostname",
"type": "text",
"tokenizer": "raw"
},
{
"indexed": true,
"fast": true,
"name": "user_agent",
"type": "text",
"tokenizer": "raw"
},
{
"indexed": true,
"fast": true,
"name": "referrer",
"type": "text",
"tokenizer": "raw"
},
{
"indexed": true,
"fast": true,
"name": "lookup",
"type": "text",
"tokenizer": "raw"
},
{
"name": "details",
"type": "object",
"field_mappings": [
{
"indexed": true,
"fast": true,
"name": "brand",
"type": "text",
"tokenizer": "raw"
},
{
"indexed": true,
"fast": true,
"name": "type",
"type": "text",
"tokenizer": "raw"
}
]
},
{
"name": "infos",
"type": "object",
"field_mappings": [
{
"indexed": true,
"fast": true,
"name": "status",
"type": "text",
"tokenizer": "raw"
},
{
"name": "status_code",
"fast": true,
"indexed": true,
"type": "u64"
},
{
"indexed": true,
"fast": true,
"name": "city",
"type": "text",
"tokenizer": "raw"
},
{
"indexed": true,
"fast": true,
"name": "region",
"type": "text",
"tokenizer": "raw"
},
{
"indexed": true,
"fast": true,
"name": "country",
"type": "text",
"tokenizer": "raw"
},
{
"indexed": true,
"fast": true,
"name": "region_code",
"type": "text",
"tokenizer": "raw"
},
{
"indexed": true,
"fast": true,
"name": "country_iso",
"type": "text",
"tokenizer": "raw"
},
{
"indexed": true,
"fast": true,
"name": "timezone",
"type": "text",
"tokenizer": "raw"
},
{
"indexed": true,
"fast": true,
"name": "utc_offset",
"type": "text",
"tokenizer": "raw"
},
{
"indexed": true,
"fast": true,
"name": "currency",
"type": "text",
"tokenizer": "raw"
},
{
"indexed": true,
"fast": true,
"name": "asn",
"type": "text",
"tokenizer": "raw"
},
{
"indexed": true,
"fast": true,
"name": "network",
"type": "text",
"tokenizer": "raw"
},
{
"indexed": true,
"fast": true,
"name": "ip",
"type": "ip"
},
{
"indexed": true,
"fast": true,
"name": "org",
"type": "text",
"tokenizer": "raw"
},
{
"indexed": true,
"fast": true,
"name": "version",
"type": "text",
"tokenizer": "raw"
},
{
"indexed": true,
"fast": true,
"name": "loc",
"type": "text",
"tokenizer": "raw"
}
]
}
],
"timestamp_field": "time",
"max_num_partitions": 200,
"index_field_presence": true,
"store_source": false,
"tokenizers": []
},
"index_id": "analytics-v0.4",
"search_settings": {
"default_search_fields": [
"website",
"cid",
"host",
"referrer",
"infos.ip",
"infos.country",
"infos.country_iso",
"infos.city",
"infos.region_code",
"infos.timezone",
"infos.currency",
"infos.version"
]
},
"version": "0.8"
}

Note: as you can see, we moved the lookup field to the root document in order to be able to use the Geomap plugin of Grafana.

Once it's done, we can use Vector, as usual, to parse this log line with the following remap function:

remap_analytics:
inputs:
- "kubernetes_logs"
type: "remap"
source: |
.time, _ = to_unix_timestamp(.timestamp, unit: "nanoseconds")

.message = string!(.message)
.message = replace(.message, r'^[^:]*:[^:]*:', "")

.body, err = parse_json(.message)
if err != null || is_null(.body) || is_null(.body.cid) || is_null(.body.type) || .body.type != "tracker" {
abort
}

.cid = .body.cid
.website = .body.website
.browser = .body.browser
.device = .body.device
.os = .body.os
.host = .body.host
.referrer = .body.referrer
.user_agent = .body.user_agent
.infos = .body.infos
.details = .body.details

if is_string(.infos.lookup) {
.lookup = del(.infos.lookup)
}

del(.timestamp)
del(.body)
del(.message)
del(.source_type)

And then the sink2:

sinks:
analytics:
type: "http"
method: "post"
inputs: ["remap_analytics"]
encoding:
codec: "json"
framing:
method: "newline_delimited"
uri: "https://xxxx:yyyyy@quickwit.yourinstance.com:443/api/v1/analytics-v0.4/ingest"

Once it's done you'll be able to do some visualization in Grafana using the Geomap plugin:

grafana-geomap

Very nice, isn't it?

Have a nice end of year and Merry Christmas 🎄 again!

Footnotes

  1. General Data Protection Regulation, a European law you can find here

  2. A sink is an output of vector which is working like an ETL (for Extract Transform Load)

Installing CWCloud on K8S is so easy!

· 3 min read
Idriss Neumann
founder cwcloud.tech

Hi and Merry Christmas 🎄.

With all the demos we've done lately, some people asks us a way to install CWCloud easily on localhost to give it a try, especially for the serverless part.

Let's start with a quick reminder on what is CWCloud: it's an agnostic deployment accelerator platform which provides the following features:

  • DaaS or Deployment as a Service: you can checkout this tutorial to understand how DaaS is working with cwcloud and what's the difference between IaaS, PaaS and DaaS.
  • FaaS or Function as a Service: you can checkout this blogpost to understand what is the purpose of this feature
  • Observability and monitoring: you can checkout this tutorial

At the time of writing, here's the different component used by CWCloud to run:

  • A RESTful API
  • A Web GUI1
  • Some asynchronous workers to schedule run the serverless function
  • ObjectStorage
  • PostgreSQL as relational and JSON database
  • Redis for the cache and message queuing
  • Flyway DB SQL migrations

It can be seen as a bit heavy but believe me it's not, it can run on a single Raspberry PI!

In order to self-host CWCloud, we provide three ways (the three are relying on docker images):

But this is not enough to bootstap it in seconds. In this blogpost we will show you how to run CWCloud with our CLI cwc using kind2 in order to use some feature which doesn't not depends on the external services like the FaaS or the monitor features.

Just a bit of reminder, here's how to install kind, kubect and helm with brew:

brew install kubectl
brew install helm
brew install kind

Then you can also install our cwc cli using brew3:

brew tap cwc/cwc https://gitlab.comwork.io/oss/cwc/homebrew-cwc.git 
brew install cwc

Once it's done, you can create your cluster with kind:

kind create cluster

And then, simply run the following command:

cwc bootstrap

Then, wait until the pods are Running:

kubectl -n cwcloud get pods

cwcloud-pods

Then you can open port-forward to the API and GUI in order to be able to open the GUI in a web browser:

cwc bootstrap pfw

You'll be able to access the GUI through this URL: localhost:3000

cwcloud-k8s-bootstrap

The default user and password are the following:

  • Username: sre-devops@comwork.io
  • Password: cloud456

Of course if you need to override some helm configurations, you can with this command:

cwc bootstrap --values my-values.yaml

It's might be necessary if you want to configure the DaaS feature which is in a "no operation" mode by default. In order to fully use it, you'll have to follow all those configurations tutorials depending on the cloud provider you want to enable.

And finally if you want to uninstall, here's the command:

cwc bootstrap uninstall

Now I'll let you with this five minutes video tutorial on how to use the FaaS, you can fully reproduce on your local environment:

faas-tutorial-player

Enjoy!

Footnotes

  1. Graphical User Interface

  2. Of course you can replace kind, by something equivalent like k3d or minikube as you wish.

  3. We also provide other way to install our cli if you don't have brew available on your operating system, you can refer to this tutorial. We're supporting Linux, MacOS and Windows for both amd64 and arm64 architectures.

Quickwit for prometheus metrics

· 4 min read
Idriss Neumann
founder cwcloud.tech

In a previous blogpost we explained how we reduced our observability bill using Quickwit thanks to its ability to store the logs and traces using object storage:

quickwit-architecture

We also said that we were using VictoriaMetrics in order to store our metrics but weren't satisfied by it lacks of object storage support.

We always wanted to store all our telemetry, including the metrics, on object storage but weren't convinced by Thanos or Mimir which still rely on Prometheus to work making them very slow.

The thing is for all of cwcloud's metrics, we're using the OpenMetrics format with a /v1/metrics endpoint like most of the modern observable applications following the state of art of observability.

Moreover, all of our relevant metrics are gauges and counter and our need is to set Grafana dashboards and alerts which looks like this:

grafana-trafic-light-dashboard

In fact, we discovered that it's perfectly perfectly feasible to setup the different threshold and do some Grafana visualizations based on simple aggregations (average, sum, min/max, percentiles) using the Quickwit's datasource:

grafana-trafic-light-visualization

However, if you're used to also search and filter metrics using PromQL in the metrics explorer, you'll have to adapt your habits to use lucene query instead:

grafana-quickwit-metrics-explorer

As you can see, it's not a big deal ;-p

That been said, in order to scrap and ingest the prometheus/openmetrics http endpoints, we choosed to use vector1 with this configuration:

sources:
prom_app_1:
type: "prometheus_scrape"
endpoints:
- "https://api.cwcloud.tech/v1/metrics"

transforms:
remap_prom_app_1:
inputs: ["prom_app_1"]
type: "remap"
source: |
if is_null(.tags) {
.tags = {}
}

.tags.source = "prom_app_1"

sinks:
quickwit_app_1:
type: "http"
method: "post"
inputs: ["remap_prom_app_1"]
encoding:
codec: "json"
framing:
method: "newline_delimited"
uri: "http://quickwit-searcher.your_ns.svc.cluster.local:7280/api/v1/prom-metrics-v0.1/ingest"

Note: you cannot transform the payload structure the way you want unlike other sources like kubernetes-logs or docker_logs sources but you can add some tags to add a bit of context. That's what we did in this example adding a source field inside the tags object.

And this is the JSON mapping to be able to match with the vector output sent to the sinks and that will make you able to make aggregations on the numeric values:

{
"doc_mapping": {
"mode": "dynamic",
"field_mappings": [
{
"name": "timestamp",
"type": "datetime",
"fast": true,
"fast_precision": "seconds",
"indexed": true,
"input_formats": [
"rfc3339",
"unix_timestamp"
],
"output_format": "unix_timestamp_nanos",
"stored": true
},
{
"indexed": true,
"fast": true,
"name": "name",
"type": "text",
"tokenizer": "raw"
},
{
"indexed": true,
"fast": true,
"name": "kind",
"type": "text",
"tokenizer": "raw"
},
{
"name": "tags",
"type": "json",
"fast": true,
"indexed": true,
"record": "basic",
"stored": true,
"tokenizer": "default"
},
{
"name": "gauge",
"type": "object",
"field_mappings": [
{
"name": "value",
"fast": true,
"indexed": true,
"type": "f64"
}
]
},
{
"name": "counter",
"type": "object",
"field_mappings": [
{
"name": "value",
"fast": true,
"indexed": true,
"type": "f64"
}
]
},
{
"name": "aggregated_summary",
"type": "object",
"field_mappings": [
{
"name": "sum",
"fast": true,
"indexed": true,
"type": "f64"
},
{
"name": "count",
"fast": true,
"indexed": true,
"type": "u64"
}
]
},
{
"name": "aggregated_histogram",
"type": "object",
"field_mappings": [
{
"name": "sum",
"fast": true,
"indexed": true,
"type": "f64"
},
{
"name": "count",
"fast": true,
"indexed": true,
"type": "u64"
}
]
}
],
"timestamp_field": "timestamp",
"max_num_partitions": 200,
"index_field_presence": true,
"store_source": false,
"tokenizers": []
},
"index_id": "prom-metrics-v0.1",
"search_settings": {
"default_search_fields": [
"name",
"kind"
]
},
"version": "0.8"
}

To conclude, despite the fact that Quickwit isn't a real TSDB2 (time-series database), we found it pretty easy with vector to still use it as a metrics backend with vector. And this way we still can say to our developer to rely on the OpenMetrics/Prometheus SDK to expose their metrics routes to scrap. However we're still encouraging some of our customer to use VictoriaMetrics because it's still experimental and some of them need more sophisticated computation capabilities3.

One of the improvements that we immediatly think about, would be to also implement the OpenTelemetry compatibility in order to be able to push metrics through OTLP/grpc protocol. We opened an issue to the quickwit's team to submit this idea but we think that it can be also done using vector as well.

Footnotes

  1. to get more details on the prometheus_scrape input, you can rely on this documentation

  2. at the time of writing, because we know that Quickwit's team plan to provide a real TSDB engine at some point

  3. for example, using multiple metrics in one PromQL query, using the range functions such as rate or irate...

Fork IT first meeting in Tunisia

· 2 min read
Ayoub Abidi
full-stack developer

On September 24th, 2024, CWCloud proudly hosted the first-ever Fork It Community Meetup in Tunisia, marking the first Fork It community event in Africa.

Fork It, a growing community of web development and UX enthusiasts, chose CWCloud's office in Tunis, as the venue for a day dedicated to knowledge sharing, insightful discussions, and networking.

forkit-meetup-09-2024

The event featured two captivating conferences by esteemed speakers:

  • Idriss Neumann delivered a talk on "Deployment as a Service (DaaS)", showcasing how to transform infrastructure as code into a functional API and product.
  • Sofiane Boukhris then shared his expertise on "Designing Effectively: Mastering Time, Cost, and Value", providing practical insights into project management and optimization.

Between the sessions, attendees enjoyed opportunities to network and discuss their experiences over a relaxed cocktail hour.

The event was a huge success, thanks in part to the invaluable support of sponsors CWCloud and CamelStudio.

CWCloud, a leading service company in application development, cloud deployment automation, and production infrastructure outsourcing, was thrilled to host this milestone event.

By supporting such initiatives, CWCloud continues to strengthen its role in building a more connected and collaborative tech community.

You can watch the full conference here (in French):

forkit-replay-09-2024

Stay tuned for more exciting events and collaborations from CWCloud and the Fork It community!