Monitors
Purpose
A monitor is an external TCP or HTTP healthcheck which is performed on your application.
Our monitor system is able to:
- present the last check in our graphical interface
- export the result as a Prometheus/OpenMetrics gauge in the
/v1/metricsendpoint of CWCloud's API - push the metrics to an opentelemetry OTLP/grpc endpoint (configured with the
OTEL_COLLECTOR_ENDPOINTenvironment variables, see the selfhosted documentation for that).
Demo
Here's a 10 min demo that will show you how to use our monitor management system:
Creating a monitor
Observability > Monitor
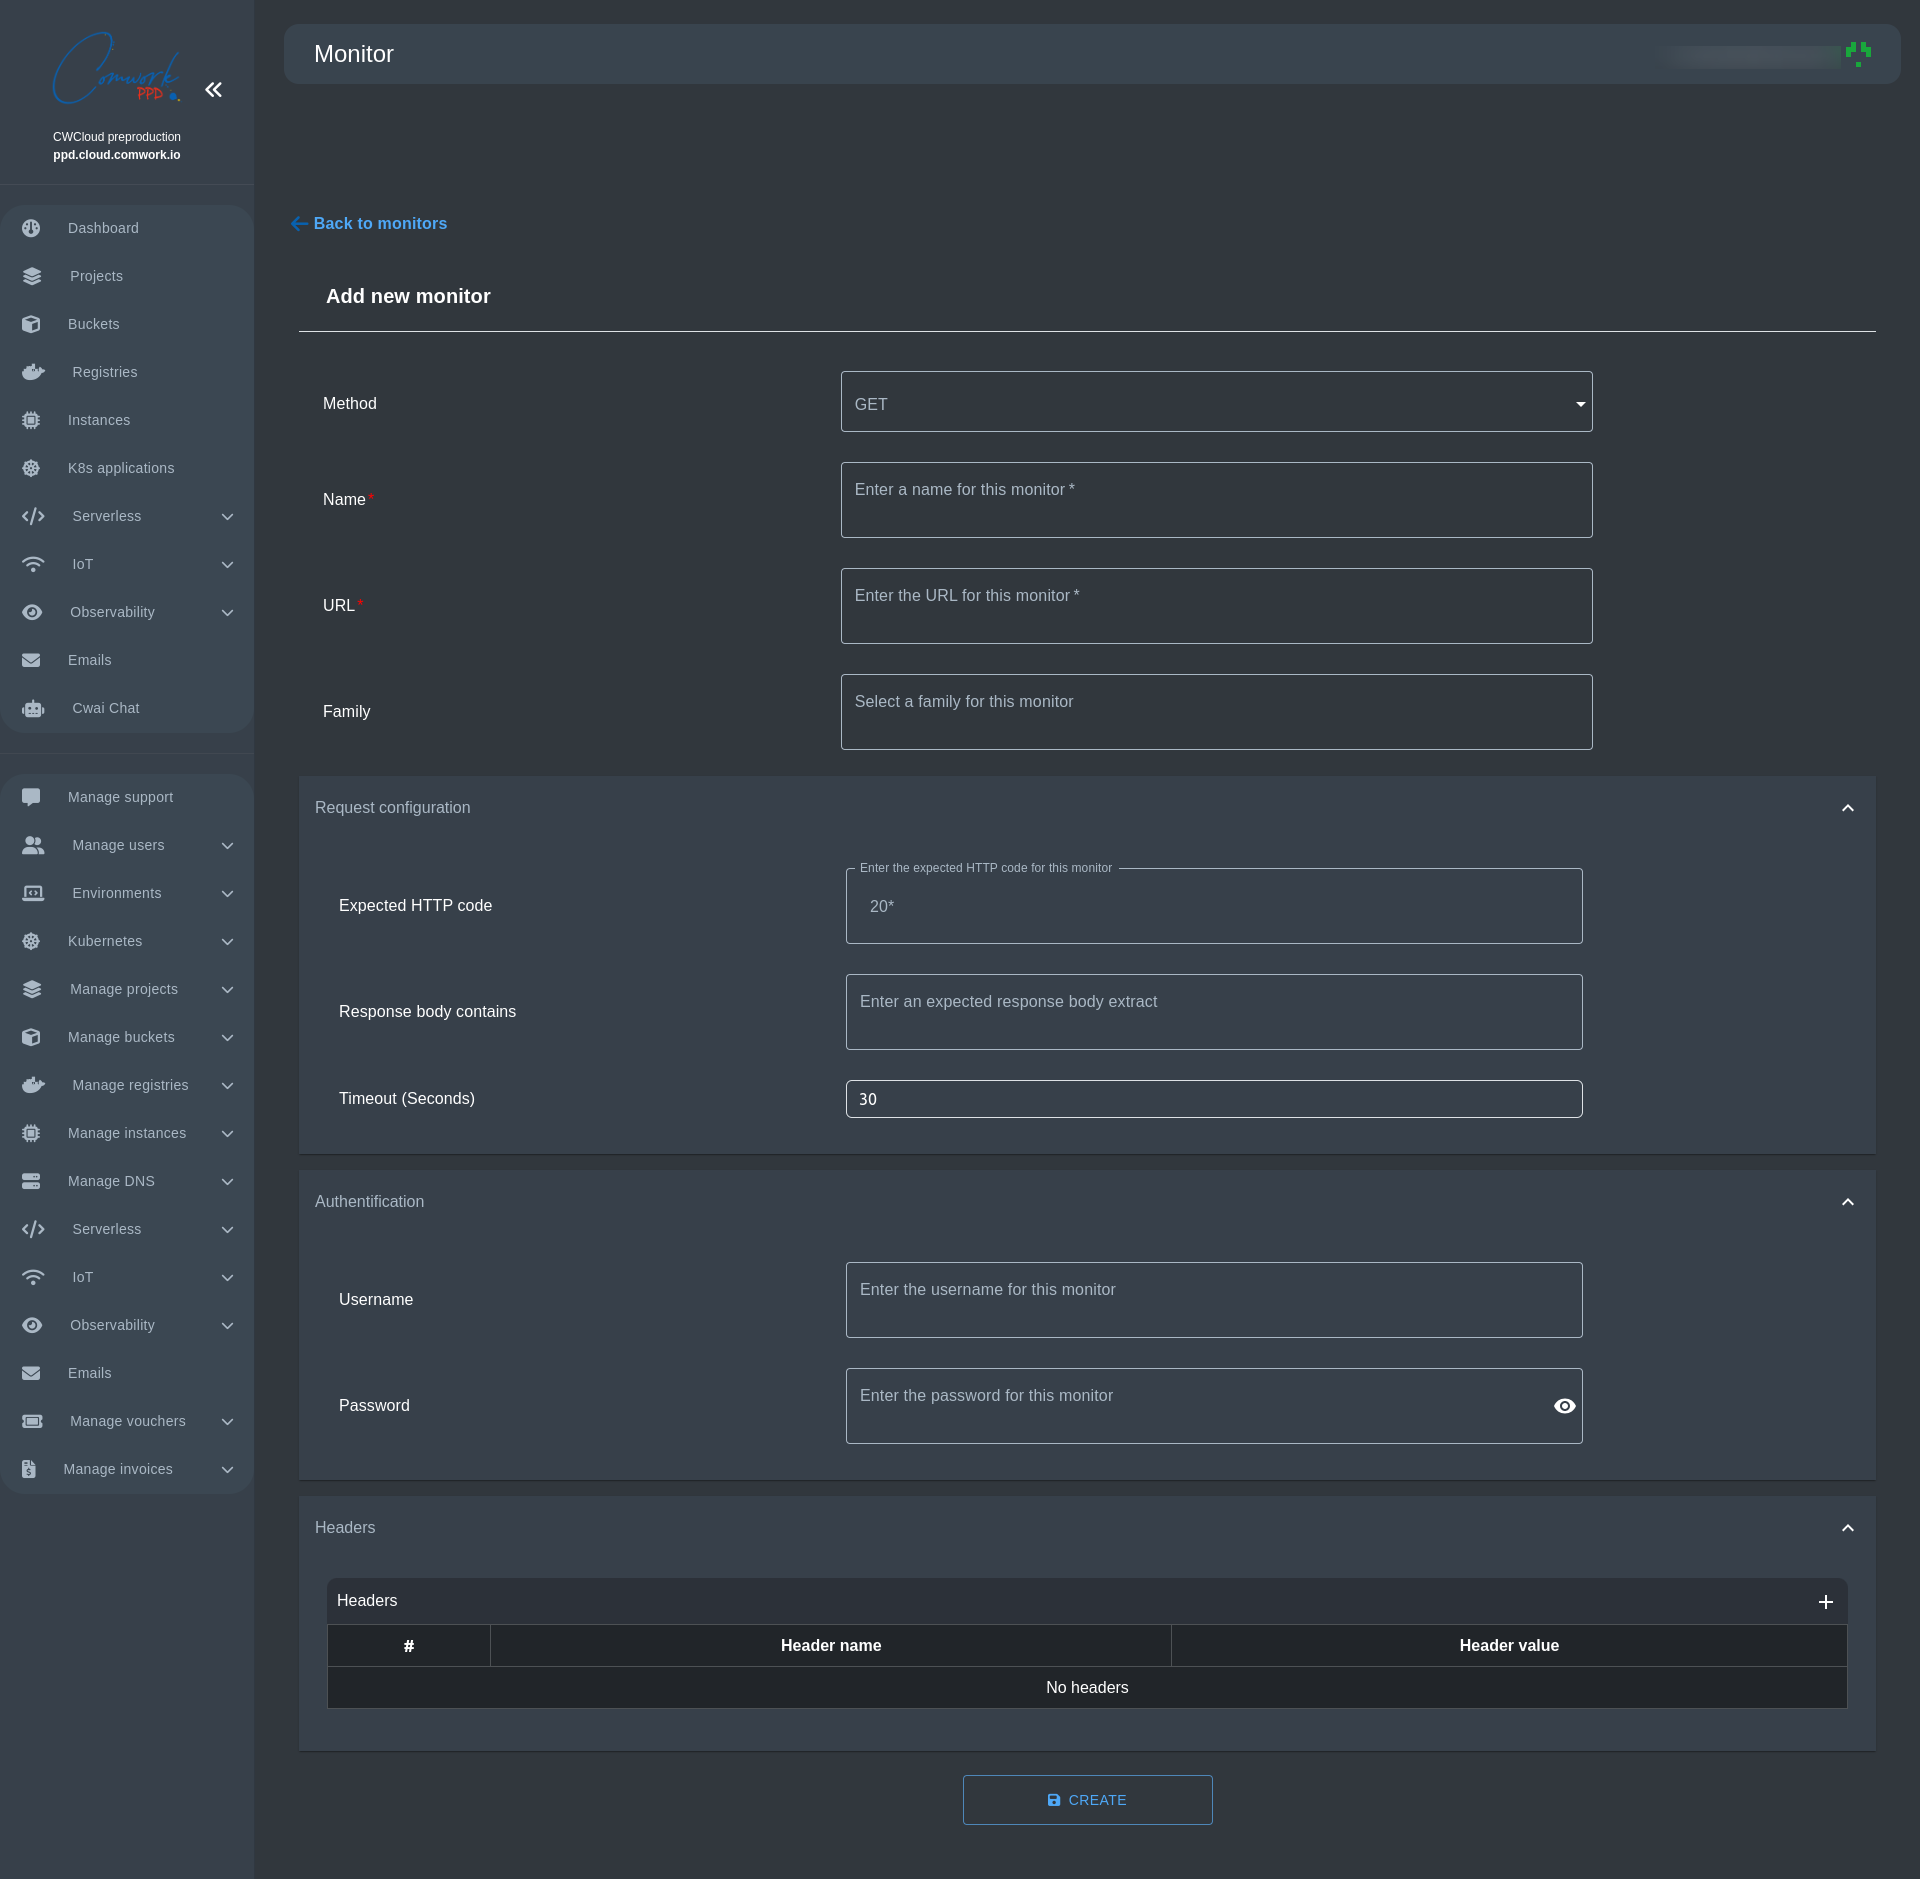
Notes:
- In the last versions you can do TCP check instead for other TCP protocols like testing database connections
- For the expected http code, you can use the
*meta caracter which is evaluated as any number. For example if you set20*, the monitor will be "success" with every http code starting by20like200,201,202... - The
response body containwill make the monitor fail if the response body doesn't contain the value - You can setup a basic authentication and custom headers
- For the
POSTandPUTmethods you can configure the request's body - You can also use the cli to create monitors, see this documentation
- You can send the checks results to http webhook, websocket or MQTT callbacks exactly the same way documented for the server serverless functions
Indexing Prometheus metrics into Quickwit
- In order to install Quickwit via CWCloud, go read this tutorial
- In order to configure Vector and Quickwit to scrap and index the Prometheus metrics, see this blogpost